Easy Debugging of Spring Boot Microservices Running on Kubernetes

Tutorial: Learn to locally debug Spring Boot microservices with IntelliJ and Telepresence connected to a remote Kubernetes cluster
Local Debugging with Mocks and Stubs Only Gets You So Far
Difficulties with Debugging Spring Boot Apps Running in Kubernetes
Tutorial: Simplified Spring Boot K8s Debugging with Telepresence
Learn More About Telepresence
Tutorial: Learn to locally debug Spring Boot microservices with IntelliJ and Telepresence connected to a remote Kubernetes cluster
Many Java- and Spring-based organizations adopt cloud native development practices with the goal of shipping features faster. The technologies and architectures may change when we move to the cloud -- just look at the rise of Spring Boot, Spring Cloud and microservices -- but the fact remains that we all still add the occasional bug to our code. The challenge here is that many of your existing local debugging tools and practices can’t be used when everything is running in a container or on the cloud. Embracing new tooling is required!
Local Debugging with Mocks and Stubs Only Gets You So Far
One of the biggest challenges when working with a microservice system is spinning up all of your services locally when testing and debugging. Once you get to a certain number of services it becomes physically impossible to run these via a local Kubernetes cluster like minikube or Kind.
The first approach often taken is to create mocks, stubs, or doubles, perhaps using something library-based like Mockito, or something out of process like Spring Cloud Contract Wiremock. Although valuable, these doubles can often encode incorrect assumptions, or they diverge over time against the real implementation. Often you are forced to sacrifice realistic testing compared to what is running within your production environment, and you end up pushing code to production with uncertainty.
In an ideal world you would be testing against all of your services running in a cluster. Accordingly, the next approach engineers take is to attempt to remotely debug their services running in a remote cluster. Often this cluster is shared; perhaps each team has their own cluster, or maybe you are using a communal staging or pre-production cluster.
Difficulties with Debugging Spring Boot Apps Running in Kubernetes
Remote debugging against Spring Boot apps running in Kubernetes can be challenging. The primary issue is exposing the debug ports for your locally running IDE or debugger to connect to. You can expose the port in your Kubernetes Service YAML, but this can be a security risk if this is deployed to production, and so you typically have to maintain two copies of the YAML when using this approach. You can use
kubectl port-forwardAs an alternative, you can spin up a local copy of the service under test and attempt to use
kubectl port-forwardTelepresence can be used to overcome both of these challenges. By setting up a two-way proxy between your local machine and remote Kubernetes cluster you can debug services locally as if they were running in the cluster i.e. your service can connect to other remote services simply using the K8s Service names and ports. Telepresence also allows the easy exporting of environment variables, which you can load into your local IDE or debugger.
Let’s now walk through a worked example of how to set all of this up.
Tutorial: Simplified Spring Boot K8s Debugging with Telepresence
Step 1: Deploy a Sample Spring Boot Microservice Application
In this tutorial we’ll build on a sample application that was introduced in a previous article. All the instructions you need to get started with debugging the “DataProcessingService” Spring Boot application are included in the article you are now reading. We assume you have access to a Kubernetes cluster, either a remote cluster or something like MiniKube running locally that you can pretend is a remote cluster. We also assume that you have a current version of Java installed, alongside either the Community or Ultimate edition of JetBrains IntelliJ IDEA.
You can find a detailed explanation of each service in the original article, and the architecture diagram below should provide a high level overview of the dependencies between services:
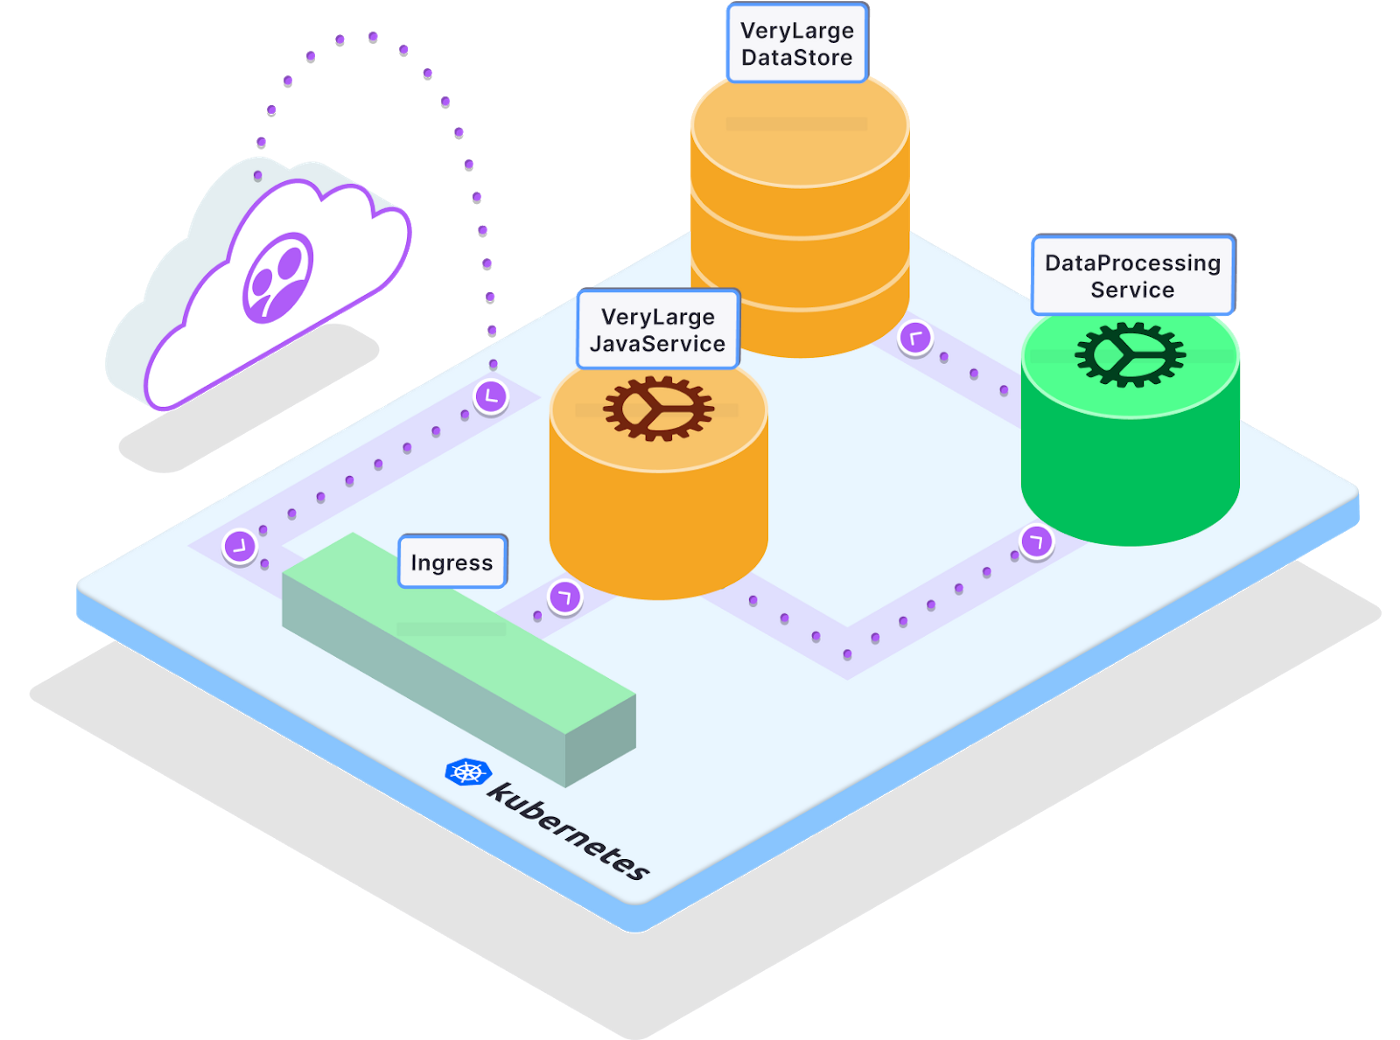
In this architecture diagram, you’ll notice that requests from users are routed through an ingress controller to our services. For simplicity’s sake, we’ll skip the step of deploying an ingress controller in this tutorial. If you’re ready to use Telepresence in your own setup and need a simple way to set up an ingress controller, we recommend checking out the Edge Stack a Kubernetes-native API Gateway.
First, let’s deploy the sample application to your Kubernetes cluster:
kubectl apply -f https://raw.githubusercontent.com/datawire/edgey-corp-java/main/k8s-config/edgey-corp-web-app-no-mapping.yaml
If you run
kubectl get svckubectl get svcNAME TYPE CLUSTER-IP EXTERNAL-IP PORT(S) AGEdataprocessingservice ClusterIP 10.3.250.98 <none> 3000/TCP 10skubernetes ClusterIP 10.3.240.1 <none> 443/TCP 2m6sverylargedatastore ClusterIP 10.3.242.75 <none> 8080/TCP 7sverylargejavaservice ClusterIP 10.3.241.208 <none> 8080/TCP 8s
Step 2: Set up your Local Spring Boot Dev Environment and IntelliJ IDEA
You will need to configure your local development environment so that you can debug the
DataProcessingServiceDataProcessingServiceVeryLargeJavaServiceVeryLargeDataStoreSo, let’s get started with using our new approach to debugging!
1. Clone the repository for this application from GitHub.
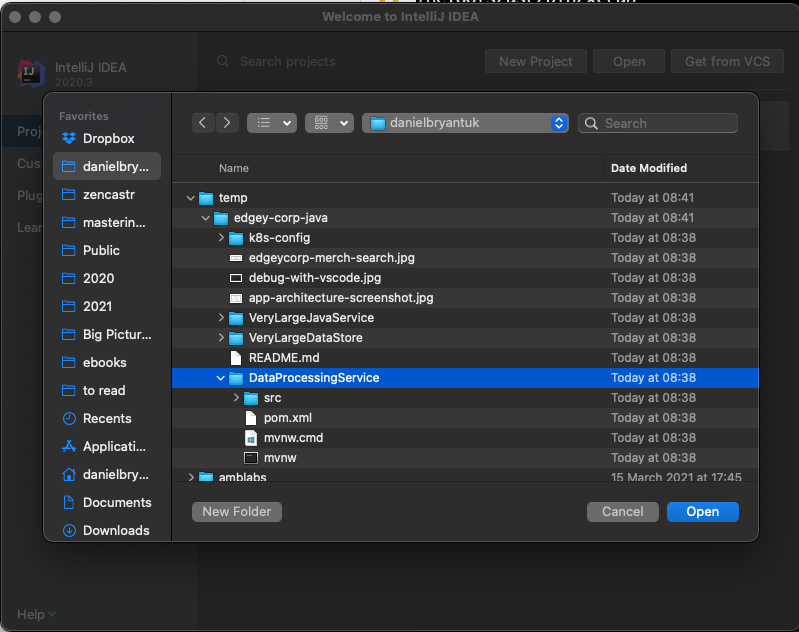
git clone https://github.com/datawire/edgey-corp-java.git2. Start IntelliJ IDEA and select “Open” from the “Welcome” screen. Navigate to the DataProcessingService and click the “Open” button
3. After the project loads into IDEA, start the application in debug mode by clicking on the bug shaped icon in the top navigation panel

4. After Maven finishes downloading dependencies you should be able to see your service running and listening on port 3000
2021-03-19 08:43:17.943 INFO 26902 --- [ restartedMain] w.s.c.ServletWebServerApplicationContext : Root WebApplicationContext: initialization completed in 581 ms2021-03-19 08:43:18.075 INFO 26902 --- [ restartedMain] o.s.s.concurrent.ThreadPoolTaskExecutor : Initializing ExecutorService 'applicationTaskExecutor'2021-03-19 08:43:18.196 INFO 26902 --- [ restartedMain] o.s.b.d.a.OptionalLiveReloadServer : LiveReload server is running on port 357292021-03-19 08:43:18.256 INFO 26902 --- [ restartedMain] o.s.b.w.embedded.tomcat.TomcatWebServer : Tomcat started on port(s): 3000 (http) with context path ''2021-03-19 08:43:18.266 INFO 26902 --- [ restartedMain] g.d.DataProcessingServiceJavaApplication : Started DataProcessingServiceJavaApplication in 1.222 seconds (JVM running for 2.356)
5. In a terminal window,
curl localhost:3000/colorblue$ curl localhost:3000/color"blue"
You now have your local service loaded into your IDE and running in debug mode! Now to connect this to the remote Kubernetes cluster.
Step 3: Install and Configure Telepresence
Instead of fiddling with remote debug protocols and exposing ports via kubectl port-forward to access services running in our remote Kubernetes cluster we are going to use Telepresence, an open source Cloud Native Computing Foundation project. Telepresence creates a bidirectional network connection between your local development and the Kubernetes cluster to enable fast, efficient Kubernetes development.
1. Install Telepresence CLI (macOS version).
# Mac OS Xsudo curl -fL https://app.getambassador.io/download/tel2/darwin/amd64/latest/telepresence -o /usr/local/bin/telepresence#Linuxsudo curl -fL https://app.getambassador.io/download/tel2/linux/amd64/latest/telepresence -o /usr/local/bin/telepresence
2. Make the binary executable
sudo chmod a+x /usr/local/bin/telepresence
3. Test Telepresence by connecting to the remote cluster
telepresence connect
4. Send a request to the remotely running DataProcessingService:
curl http://dataprocessingservice.default.svc.cluster.local:3000/color"green"
5. Notice two things here:
- You are able to refer to the remote Service directly via its internal cluster name as if your development machine is inside the cluster
- The color returned by the remote DataProcessingService is “green”, versus the local result you saw above of “blue”
Great! You’ve successfully configured Telepresence. Right now Telepresence is “intercepting” (discussed below) the request you’re making to the Kubernetes API server, and routing over its direct connection to the cluster instead of over the Internet.
Step 4: Intercept Remote Traffic and Debug Your Local Service
An intercept is a routing rule for Telepresence. You can create an intercept to route all traffic intended for the
DataProcessingServiceDataProcessingService1. Create the intercept
telepresence intercept dataprocessingservice --port 3000
Using deployment dataprocessingserviceinterceptedIntercept name : dataprocessingserviceState : ACTIVEDestination : 127.0.0.1:3000Volume Mount Error: macFUSE 4.0.5 or higher is required on your local machineIntercepting : all TCP connections
2. Access the application directly with Telepresence. Visit http://verylargejavaservice:8080 in your browser. Again, Telepresence is intercepting requests from your browser and routing them directly to the Kubernetes cluster. You should see a web page that displays the architecture of the system you have deployed into your cluster:
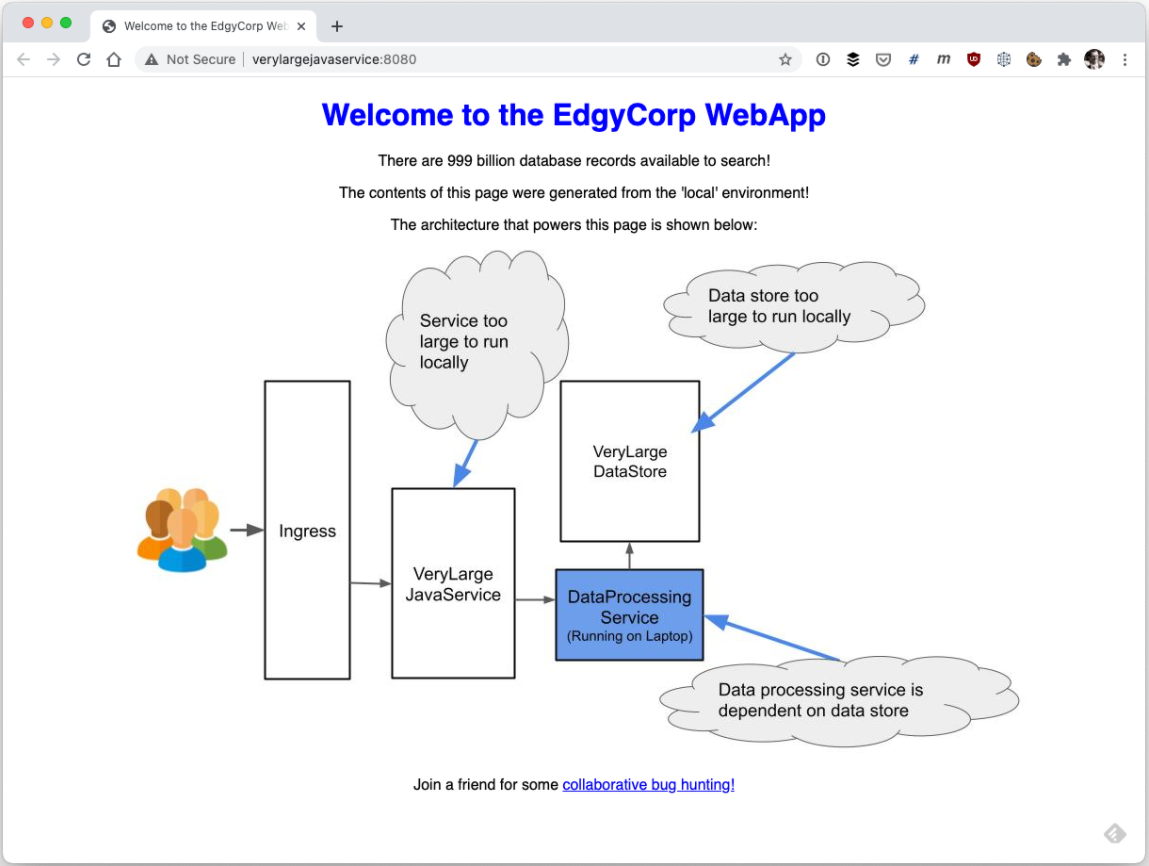
Note that the color of the title and DataProcessingService box is blue. This is because the color is being determined by the locally running copy of the DataProcessingService, as the Telepresence intercept is routing the remote cluster traffic to this.
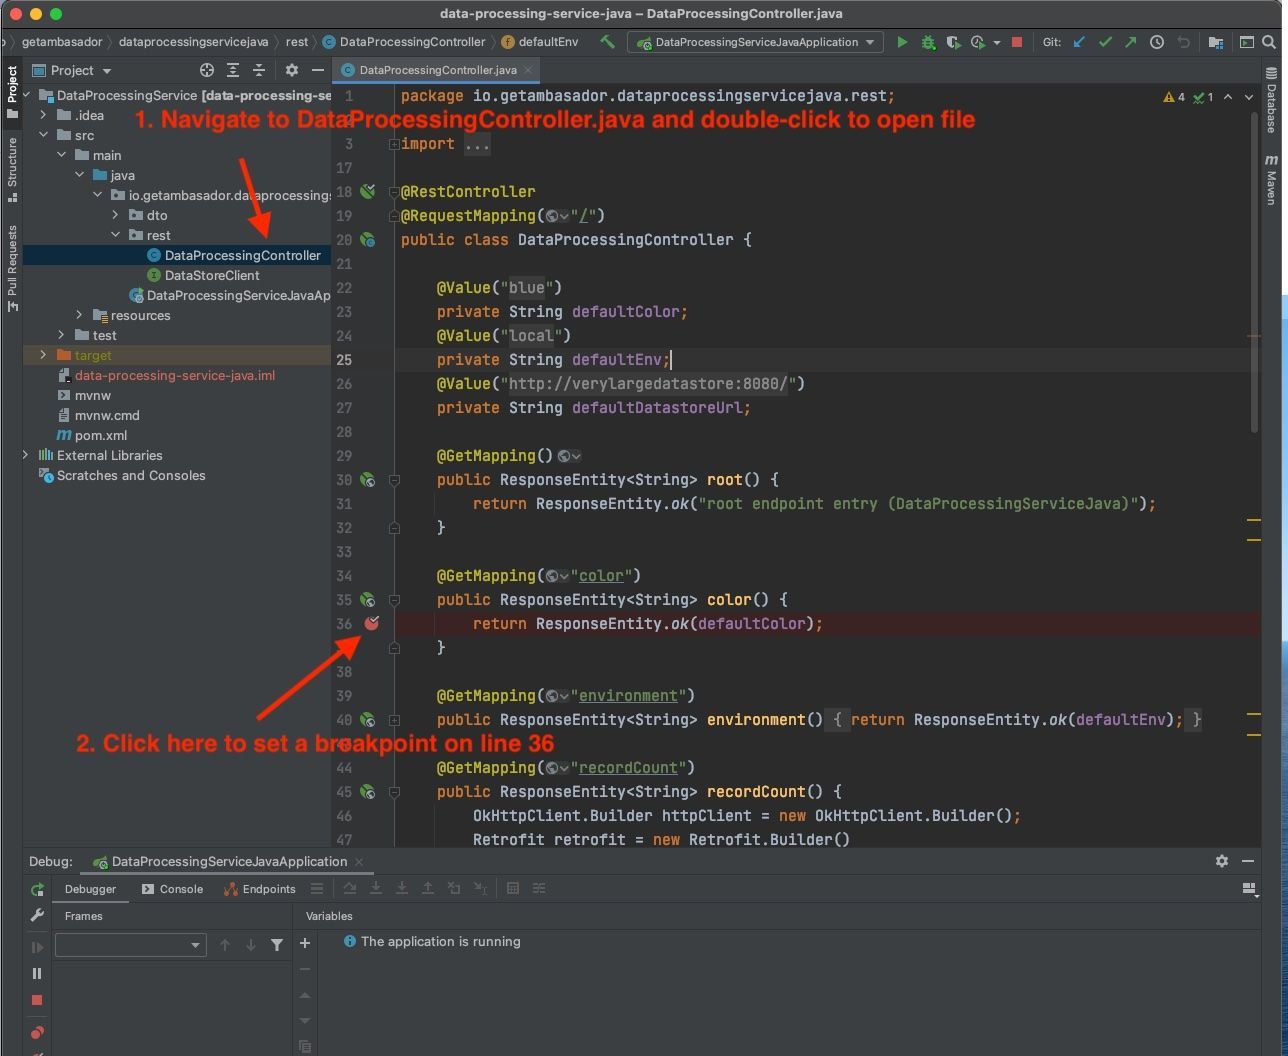
Within IntelliJ use the “Project” window to navigate to the “DataProcessingController.java” file. Once this file is open set a breakpoint on line 36, by clicking once in the margin next to the line number. This breakpoint will be triggered when the “color” endpoint of the DataProcessingService is called.
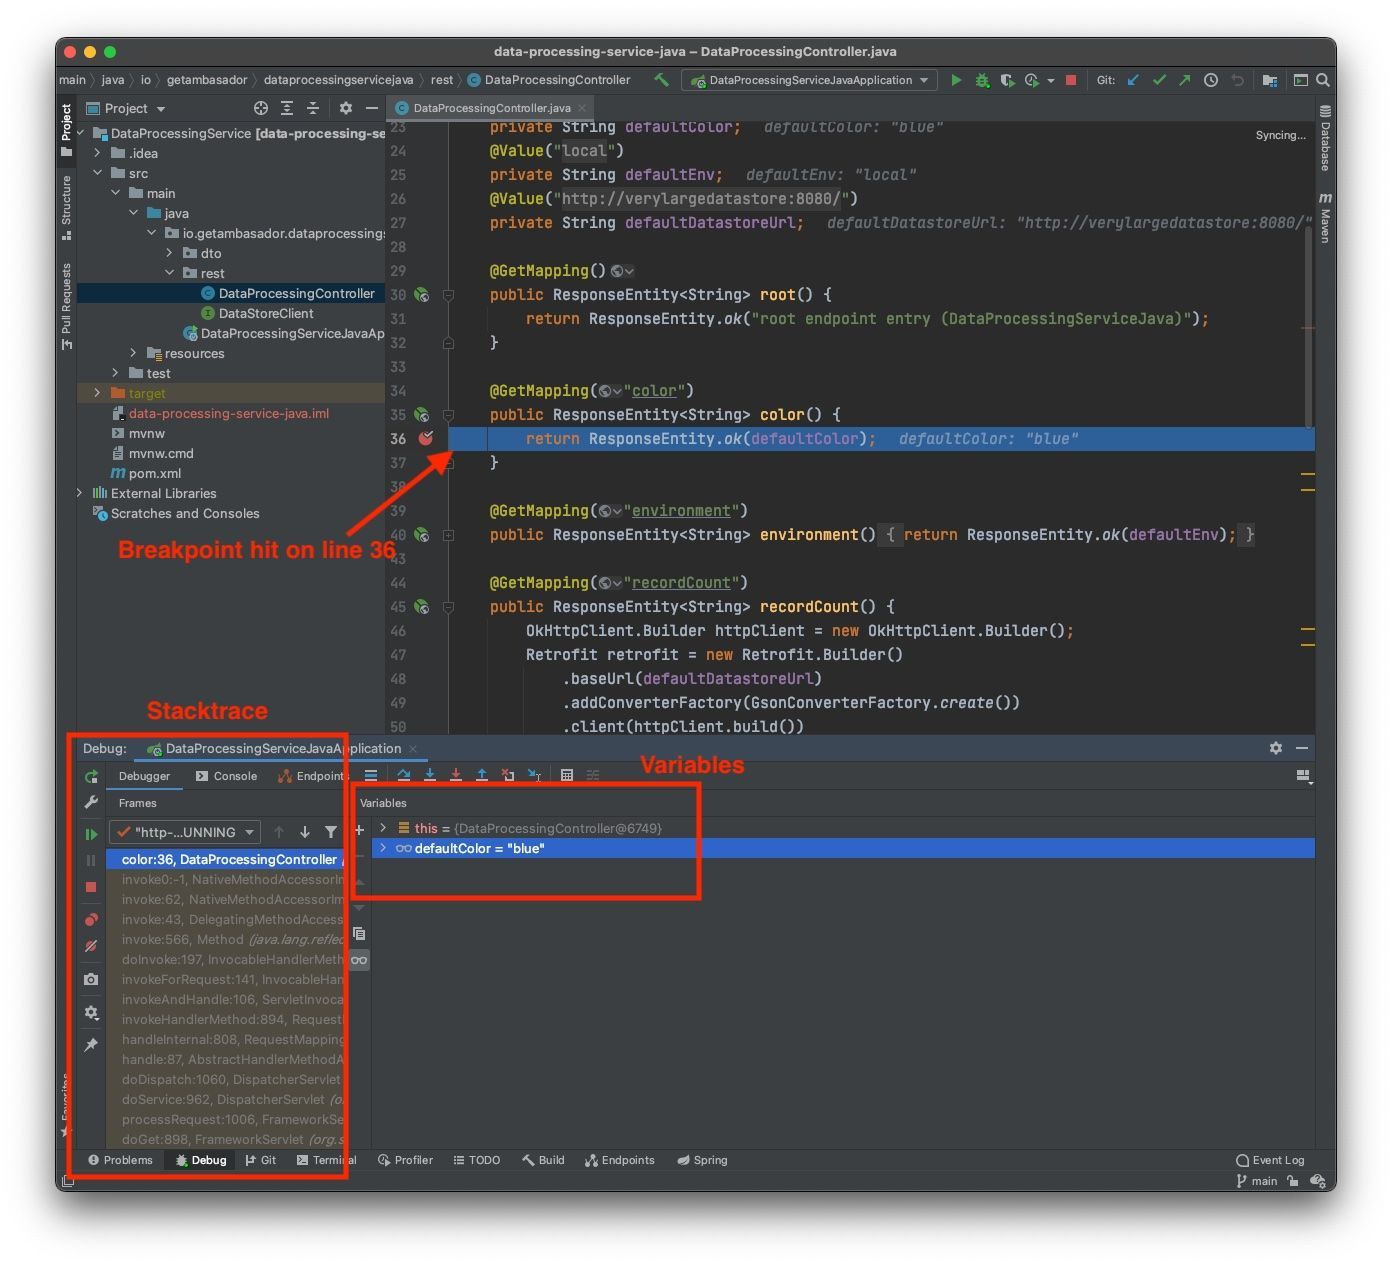
In your browser, visit http://verylargejavaservice:8080 again. Notice how IDEA immediately jumps to the foreground on your desktop with the breakpoint hit. You can view the stack trace in the bottom left corner of the Debug window and you can also see the current variables involved. At this point you can perform all of the debug actions you typically can, e.g. inspecting variable values, changing variables, stepping through and over code, and halting execution.
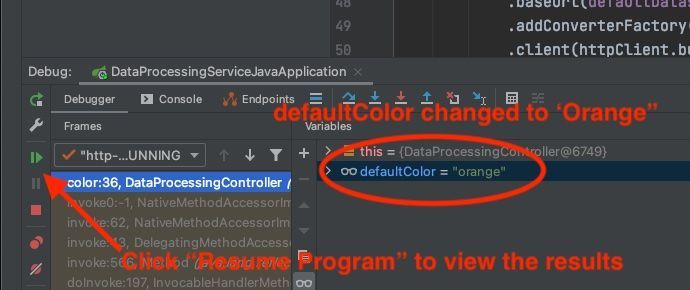
Right click on the defaultColor variable in the Debug variables window, and select “View/Edit Text” from the menu. In the “View/Edit Text” popup that is shown change the text from blue to orange by deleting the current text and typing “orange”. Click “Set”.
Next click the “Resume Program” icon in the left panel of the Debug window
Your browser window should complete reloading, and display an orange color for the title and DataProcessingService box:
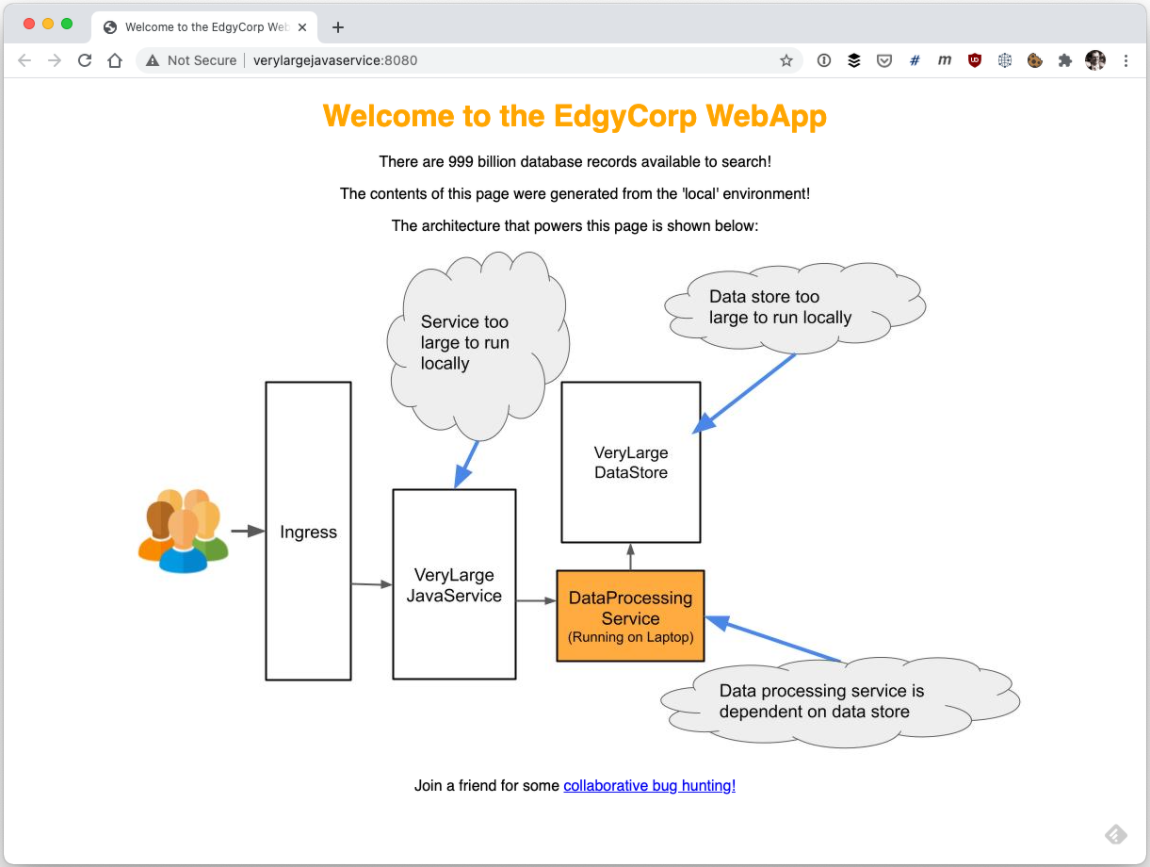
Success! You have successfully made a request to the remote VeryLargeJavaService and Telepresence has intercepted the call this service has made to the remote DataProcessingService and rerouted the traffic to your local copy running in debug mode!
In addition to rapidly inspecting and changing variables locally, you can also step through the execution of the local service as if it were running in the remote cluster. You can view data passed into the local service from the service running in the remote cluster, and interact with other services running in the cluster as if you were also running here.
Bonus: Loading K8s Environment Variables into IntelliJ
Telepresence also allows you to locally access the environment variables your service has access to in the remote cluster. This is useful if you store essential configuration in Kubernetes environment variables for service discovery, selection of runtime profile names, or feature flag config etc.
You can leave the intercept you created above and modify the Telepresence command line flags to export the environment variables into a JSON file:
telepresence leave dataprocessingservicetelepresence intercept dataprocessingservice --port 3000 --env-json=my-envs.jsonUsing deployment dataprocessingserviceinterceptedIntercept name : dataprocessingserviceState : ACTIVEDestination : 127.0.0.1:3000Volume Mount Error: macFUSE 4.0.5 or higher is required on your local machineIntercepting : all TCP connections$ head my-envs.json{"DATAPROCESSINGSERVICE_PORT": "tcp://10.3.253.235:3000","DATAPROCESSINGSERVICE_PORT_3000_TCP": "tcp://10.3.253.235:3000","DATAPROCESSINGSERVICE_PORT_3000_TCP_ADDR": "10.3.253.235","DATAPROCESSINGSERVICE_PORT_3000_TCP_PORT": "3000","DATAPROCESSINGSERVICE_PORT_3000_TCP_PROTO": "tcp","DATAPROCESSINGSERVICE_SERVICE_HOST": "10.3.253.235","DATAPROCESSINGSERVICE_SERVICE_PORT": "3000","KO_DATA_PATH": "/var/run/ko","KUBERNETES_PORT": "tcp://10.3.240.1:443",
This JSON file can be loaded into IntelliJ by using the EnvFile Plugin, which can be installed via the “Plugins” available in the “Preferences” menu.
You will need to restart your IDE after the installation completes. If the DataProcessingService is not automatically loaded into the IDE, select it from the “Projects” tab in the welcome window.
As shown in the image below, you can load the environment variable file generated by Telepresence into your current project in IDEA by clicking on the (1) Application name in the run configuration panel at the top of the window. In the window that opens, select the EnvFile tab and then click the (2) “+” icon at the bottom of this tab. In the file system navigator that is displayed select the Telepresence environment variable file. The EnvFile tab then updates to show the successful selection (3).
Now the application you are debugging can read the environment variables as if this process was running within the remote cluster.
You can also locally access volumes mounted into your remote Services. This is useful if you are storing configuration, tokens, or other state required for the proper execution of the service. We’ll cover this in more detail in a future tutorial.
Learn More About Telepresence
In this article you’ve learned how to use Telepresence to easily debug a Spring Boot microservice running in Kubernetes. Now, instead of trying to mock out dependencies or fiddle around with remote debugging, you can iterate quickly with an instant feedback loop when locally debugging using your favorite IDE and tools.
If you want to learn more about Telepresence, check out the following resources:
- Read the docs
- Watch the demo video
- Read more about Intercepts
- Learn about Preview URLs for easy collaboration with teammates
- Join our Slack channel to connect with the Telepresence community