Monitoring Envoy and Edge Stack on Kubernetes with the Prometheus Operator


With the Prometheus Operator
Envoy, Ambassador, and Prometheus
Prerequisites
Deploy the Prometheus Operator
Deploy Ambassador
Configure Prometheus
Testing
Get a service running in Envoy
Conclusion
With the Prometheus Operator
In the Kubernetes ecosystem, one of the emerging themes is how applications can best take advantage of the various capabilities of Kubernetes. The Kubernetes community has also introduced new concepts, such as Custom Resources, to make it easier to build Kubernetes-native software.
In late 2016, CoreOS introduced the Operator pattern and released the Prometheus Operator as a working pattern example. The Prometheus Operator automatically creates and manages Prometheus monitoring instances.
The operator model is especially powerful for cloud native organizations deploying multiple services. In this model, each team can deploy its own Prometheus instance as necessary instead of relying on a central SRE team to implement monitoring
Envoy, Ambassador, and Prometheus
In this tutorial, we'll show how the Prometheus Operator can be used to monitor an Envoy proxy deployed at the edge. Envoy is an open source L7 proxy. One of the many reasons for Envoy's growing popularity is its emphasis on observability. Envoy uses statsD as its output format.
Instead of using Envoy directly, we'll use Edge Stack. Edge Stack is a Kubernetes-native API Gateway built on Envoy. Similar to the Prometheus Operator, Ambassador configures and manages Envoy instances in Kubernetes so that the end user doesn't need to do that work directly.
Prerequisites
This tutorial assumes you're running Kubernetes 1.8 or later, with RBAC enabled.
Note: If you're running on Google Kubernetes Engine, you'll need to grant
cluster-admin$ gcloud info | grep AccountAccount: [username@example.org]$ kubectl create clusterrolebinding my-cluster-admin-binding --clusterrole=cluster-admin --user=username@example.org
Deploy the Prometheus Operator
The Prometheus Operator is configured as a Kubernetes
deploymentapiVersion: rbac.authorization.k8s.io/v1beta1kind: ClusterRoleBindingmetadata:name: prometheus-operatorroleRef:apiGroup: rbac.authorization.k8s.iokind: ClusterRolename: prometheus-operatorsubjects:- kind: ServiceAccountname: prometheus-operatornamespace: default---apiVersion: rbac.authorization.k8s.io/v1beta1kind: ClusterRolemetadata:name: prometheus-operatorrules:- apiGroups:- extensionsresources:- thirdpartyresourcesverbs:- "*"- apiGroups:- apiextensions.k8s.ioresources:- customresourcedefinitionsverbs:- "*"- apiGroups:- monitoring.coreos.comresources:- alertmanagers- prometheuses- servicemonitorsverbs:- "*"- apiGroups:- appsresources:- statefulsetsverbs: ["*"]- apiGroups: [""]resources:- configmaps- secretsverbs: ["*"]- apiGroups: [""]resources:- podsverbs: ["list", "delete"]- apiGroups: [""]resources:- services- endpointsverbs: ["get", "create", "update"]- apiGroups: [""]resources:- nodesverbs: ["list", "watch"]- apiGroups: [""]resources:- namespacesverbs: ["list"]---apiVersion: v1kind: ServiceAccountmetadata:name: prometheus-operator---apiVersion: extensions/v1beta1kind: Deploymentmetadata:labels:k8s-app: prometheus-operatorname: prometheus-operatorspec:replicas: 1template:metadata:labels:k8s-app: prometheus-operatorspec:containers:- args:- --kubelet-service=kube-system/kubelet- --config-reloader-image=quay.io/coreos/configmap-reload:v0.0.1image: quay.io/coreos/prometheus-operator:v0.15.0name: prometheus-operatorports:- containerPort: 8080name: httpresources:limits:cpu: 200mmemory: 100Mirequests:cpu: 100mmemory: 50MiserviceAccountName: prometheus-operator
kubectl apply -f prom-operator.yamlWe'll also want to create an additional
ServiceAccountapiVersion: v1kind: ServiceAccountmetadata:name: prometheus---apiVersion: rbac.authorization.k8s.io/v1beta1kind: ClusterRolemetadata:name: prometheusrules:- apiGroups: [""]resources:- nodes- services- endpoints- podsverbs: ["get", "list", "watch"]- apiGroups: [""]resources:- configmapsverbs: ["get"]- nonResourceURLs: ["/metrics"]verbs: ["get"]---apiVersion: rbac.authorization.k8s.io/v1beta1kind: ClusterRoleBindingmetadata:name: prometheusroleRef:apiGroup: rbac.authorization.k8s.iokind: ClusterRolename: prometheussubjects:- kind: ServiceAccountname: prometheusnamespace: default
kubectl apply -f prom-rbac.yamlThe Operator functions as your virtual SRE. At all times, the Prometheus operator insures that you have a set of Prometheus servers running with the appropriate configuration.
Deploy Ambassador
Ambassador also functions as your virtual SRE. At all times, Ambassador insures that you have a set of Envoy proxies running the appropriate configuration.
We're going to deploy Ambassador into Kubernetes. On each Ambassador pod, we'll also deploy an additional container that runs the Prometheus statsd exporter. The exporter will collect the statsd metrics emitted by Envoy over UDP, and proxy them to Prometheus over TCP in Prometheus metrics format.
---apiVersion: v1kind: Servicemetadata:labels:service: ambassador-adminname: ambassador-adminspec:type: NodePortports:- name: ambassador-adminport: 8877targetPort: 8877selector:service: ambassador---apiVersion: rbac.authorization.k8s.io/v1beta1kind: ClusterRolemetadata:name: ambassadorrules:- apiGroups: [""]resources:- servicesverbs: ["get", "list", "watch"]- apiGroups: [""]resources:- configmapsverbs: ["create", "update", "patch", "get", "list", "watch"]- apiGroups: [""]resources:- secretsverbs: ["get", "list", "watch"]---apiVersion: v1kind: ServiceAccountmetadata:name: ambassador---apiVersion: rbac.authorization.k8s.io/v1beta1kind: ClusterRoleBindingmetadata:name: ambassadorroleRef:apiGroup: rbac.authorization.k8s.iokind: ClusterRolename: ambassadorsubjects:- kind: ServiceAccountname: ambassadornamespace: default---apiVersion: extensions/v1beta1kind: Deploymentmetadata:name: ambassadorspec:replicas: 1template:metadata:labels:service: ambassadorspec:serviceAccountName: ambassadorcontainers:- name: ambassadorimage: datawire/ambassador:0.21.0imagePullPolicy: Alwaysresources:limits:cpu: 1memory: 400Mirequests:cpu: 200mmemory: 100Mienv:- name: AMBASSADOR_NAMESPACEvalueFrom:fieldRef:fieldPath: metadata.namespacelivenessProbe:httpGet:path: /ambassador/v0/check_aliveport: 8877initialDelaySeconds: 3periodSeconds: 3readinessProbe:httpGet:path: /ambassador/v0/check_readyport: 8877initialDelaySeconds: 3periodSeconds: 3- name: statsd-sinkimage: datawire/prom-statsd-exporter:0.6.0restartPolicy: Always
kubectl apply -f ambassador-rbac.yamlAmbassador is typically deployed as an API Gateway at the edge of your network. We'll deploy a service to map to the Ambassador
deploymentNodePortLoadBalancer---apiVersion: v1kind: Servicemetadata:labels:service: ambassadorname: ambassadorspec:type: LoadBalancerports:- name: ambassadorport: 80targetPort: 80selector:service: ambassador
kubectl apply -f ambassador.yamlYou should now have a working Ambassador and StatsD/Prometheus exporter that is accessible from outside your cluster.
Configure Prometheus
We now have Ambassador/Envoy running, along with the Prometheus Operator. How do we hook this all together? Logically, all the metrics data flows from Envoy to Prometheus in the following way:
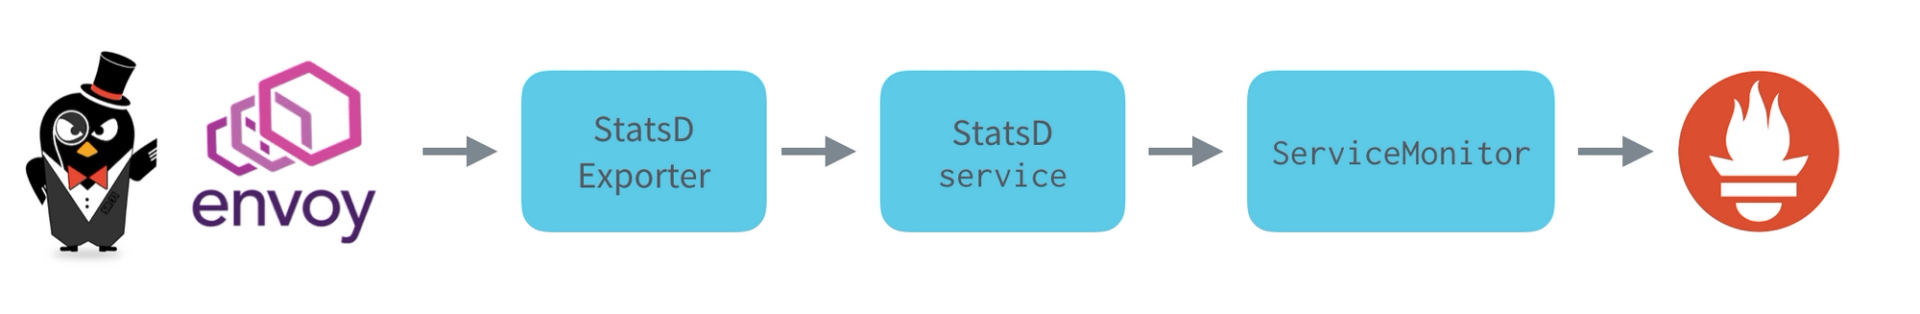
So far, we've deployed Envoy and the StatsD exporter, so now it's time to deploy the other components of this flow.
We'll first create a Kubernetes
serviceServiceMonitor---apiVersion: v1kind: Servicemetadata:name: ambassador-monitorlabels:service: ambassador-monitorspec:selector:service: ambassadortype: ClusterIPclusterIP: Noneports:- name: prometheus-metricsport: 9102targetPort: 9102protocol: TCP---apiVersion: monitoring.coreos.com/v1kind: ServiceMonitormetadata:name: ambassador-monitorlabels:ambassador: monitoringspec:selector:matchLabels:service: ambassador-monitorendpoints:- port: prometheus-metrics
kubectl apply -f statsd-sink-svc.yamlNext, we need to tell the Prometheus Operator to create a Prometheus cluster for us. The Prometheus cluster is configured to collect data from any
ServiceMonitorambassador:monitoringapiVersion: monitoring.coreos.com/v1kind: Prometheusmetadata:name: prometheusspec:serviceAccountName: prometheusserviceMonitorSelector:matchLabels:ambassador: monitoringresources:requests:memory: 400Mi
kubectl apply -f prometheus.yamlFinally, we can create a service to expose Prometheus to the rest of the world. Again, if you're not on AWS or GKE, you'll want to use a
NodePortapiVersion: v1kind: Servicemetadata:name: prometheusspec:type: NodePortports:- name: webport: 9090protocol: TCPtargetPort: webselector:prometheus: prometheus
kubectl apply -f prom-svc.yamlTesting
We've now configured Prometheus to monitor Envoy, so now let's test this out. Get the external IP address for Prometheus.
$ kubectl get servicesNAME CLUSTER-IP EXTERNAL-IP PORT(S) AGEambassador 10.11.255.93 35.221.115.102 80:32079/TCP 3hambassador-admin 10.11.246.117 <nodes> 8877:30366/TCP 3hambassador-monitor None <none> 9102/TCP 3hkubernetes 10.11.240.1 <none> 443/TCP 3hprometheus 10.11.254.180 35.191.39.173 9090:32134/TCP 3hprometheus-operated None <none> 9090/TCP 3h
In the example above, this is
35.191.39.173Troubleshooting
If the above doesn't work, there are a few things to investigate:
- Make sure all your pods are running ()
kubectl get pods - Check the logs on the Prometheus cluster ()
kubectl logs $PROM_POD prometheus - Check Ambassador diagnostics to verify Ambassador is working correctly
Get a service running in Envoy
The metrics so far haven't been very interesting, since we haven't routed any traffic through Envoy. We'll use Ambassador to set up a route from Envoy to the httpbin service. Ambassador is configured using Kubernetes annotations, so we'll do that here.
apiVersion: v1kind: Servicemetadata:name: httpbinannotations:getambassador.io/config: |---apiVersion: ambassador/v0kind: Mappingname: httpbin_mappingprefix: /httpbin/service: httpbin.org:80host_rewrite: httpbin.orgspec:ports:- port: 80
kubectl apply -f httpbin.yamlNow, if we get the external IP address of Ambassador, we can route requests through Ambassador to the httpbin service:
$ kubectl get servicesNAME CLUSTER-IP EXTERNAL-IP PORT(S) AGEambassador 10.11.255.93 35.221.115.102 80:32079/TCP 3hambassador-admin 10.11.246.117 <nodes> 8877:30366/TCP 3hambassador-monitor None <none> 9102/TCP 3hkubernetes 10.11.240.1 <none> 443/TCP 3hprometheus 10.11.254.180 35.191.39.173 9090:32134/TCP 3hprometheus-operated None <none> 9090/TCP 3h$ curl http://35.221.115.102/httpbin/ip{"origin": "35.214.10.110"}
Run a
curlhttpbinConclusion
Microservices, as you know, are distributed systems. The key to scaling distributed systems is creating loose coupling between each of the components. In a microservices architecture, the most painful source of coupling is actually organizational and not architectural. Design patterns such as the Prometheus Operator enable teams to be more self-sufficient, and reduce organizational coupling, enabling teams to code faster.
Next Steps
- Learn more about monitoring ingress with Prometheus.
- Need some expert help? Speak with an expert to see how we might be able to help improve your current development workflow.
- Check out Telepresence and Edge Stack for more info.