
Let's say you have a production system or cluster up and running. Your resources are limited, so you would want your pods to take up only what is required in terms of Kubernetes resources
Unfortunately, a particular app in your cluster might take up a lot of resources, leading to fewer overall resources. Subsequently, other apps fail. If you had not set up monitoring, you'd have to face this issue during production, causing your app to experience downtime. We wouldn't want that. Of course, we can always be reactive and fix the issue after it has occurred, but do you know what's better? Being proactive!
By setting up monitoring beforehand, you can detect when a certain pod or node is low on resources or when there's an internal error. With this information, you could set up actions such as notifications when a pod's CPU usage reaches a threshold or when a certain pod crashes. A well maintained monitoring system adds a safety basket for your production setting, creates a better developer experience for the developers on your team, and ensures end-users aren't negatively impacted. This article explains how to monitor a Kubernetes cluster effectively using Prometheus.

How to get started with Kubernetes monitoring
API Monitoring a Kubernetes cluster involves choosing a monitoring tool that can collect application metrics such as traffic or memory usage from target kubernetes pods or services, allowing you to monitor said target's health. These tools are deployed on the cluster as sidecar containers for you to regularly receive metrics so that you can then use those metrics for analyzing them through visualization tools.
For this blog, we'll be exploring an excellent open source tool: Prometheus as the monitoring solution. We'll set up a Kubernetes cluster and then install Prometheus on it. We'll then use Prometheus to pull metrics from target endpoints and discuss how the metrics are being stored locally. Finally, we'll visualize those metrics in a Grafana dashboard.
Let's start 😄
Setting up the Kubernetes cluster
As part of the first step, we'll deploy a Kubernetes cluster on MicroK8s
sudo snap install microk8s --classic
microk8s enable dns storage metrics-server
While writing this blog initially, I faced issues on Minikube, so I advise you to proceed with MicroK8s or other offerings. Once we have MicroK8s installed, we should have our Kubernetes cluster up and running. To not have to type microk8s every time, let’s create an alias for it inside the .bashrc file by running the commands below:
Now, let's create a directory for our project and choose a name. Choose a name that would work well for this project. Now, to confirm that our Kubernetes cluster is up, run the following:
kubectl cluster-info
Upon having our Kubernetes cluster ready, let's create our namespace and update our context so that we’re a step closer to getting our kubernetes monitoring solution:
kubectl create namespace monitoring
kubectl config set-context --current --namespace=monitoring
Installing Prometheus
There are different ways to install Prometheus on a cluster. You could create and apply all the individual manifest files for Prometheus separately, but this would result in much manual labor. You should only go down this path if you need that level of granularity and control. Let’s use the kube-prometheus-stack Helm chart instead, as that’s the most straightforward way to do it because it takes care of setting up all the individual components along with the operator itself.
Run these commands in your terminal to install Prometheus into your cluster:
Make sure that you have Helm installed
helm repo add prometheus-community https://prometheus-community.github.io/helm-charts
helm repo update
helm install prometheus prometheus-community/kube-prometheus-stack
If you get this error
Error: Kubernetes cluster unreachable
, then run this command
kubectl config view --raw > ~/.kube/config
and then run the above commands again. This saves the current Kubernetes configuration, including cluster information into the
~/.kube/config
file.
You are all set! You now have Prometheus set up in your cluster. Now, upon running
kubectl get all
, you see different components being set up. Let's go over these components.
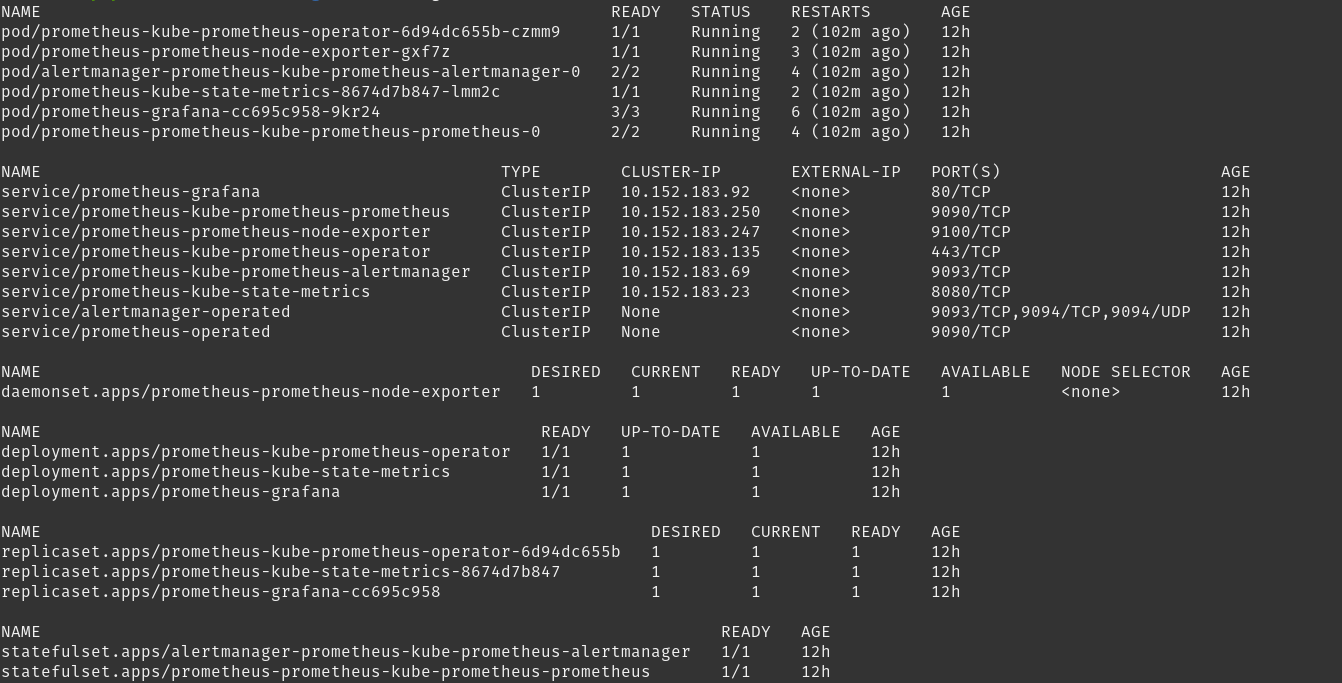
- There are three different Deployments here. The first one is the Prometheus operator, which is present to install Prometheus and all its components. Next is the Kube state metrics, whose purpose is to ensure you can access the health metrics of all the individual Kubernetes components, and lastly, the Grafana deployment, which was coupled into the Helm chart.
- For the Deployments mentioned above, you have their corresponding ReplicaSets and StatefulSets being created. The StatefulSets being created are interesting since one is the Alert Manager, which is designed to handle sending out alerts based on configured rules. Another is the Prometheus server, which stores metrics from the target sources.
- The Node Exporter Daemonset runs on each node so that the kernel-level metrics for the host machine, such as network stats or CPU usage, can be presented in a format that Prometheus can further scrape from.
- The Services of type ClusterIP indicate services being set up for internal communication between Prometheus and the monitoring stack, Grafana, Alert Manager, and more.
- The Pods are being created from the StatefulSets and Deployments mentioned above.
To give an overview, all of these components deployed form the entire Prometheus monitoring stack. This is great because now you're saved from the pain of having to set up the whole stack yourself.
Setting up the application
Now that we have our monitoring set up, we can write the manifest for our application. For our case, we will be deploying a Mongodb app and then monitor the kubernetes cluster it runs on. The manifest files are as follows:
mongodb-deployment.yaml:
apiVersion: apps/v1
kind: Deployment
metadata:
name: mongodb-deployment
spec:
replicas: 1
selector:
matchLabels:
app: mongodb
template:
metadata:
labels:
app: mongodb
spec:
containers:
- name: mongodb
image: mongo:latest
ports:
- containerPort: 27017
mongodb-service.yaml:
apiVersion: v1
kind: Service
metadata:
name: mongodb-service
spec:
selector:
app: mongodb
ports:
- protocol: TCP
port: 27017
targetPort: 27017
Save and apply them both using these commands:
kubectl apply -f mongodb-deployment.yaml
kubectl apply -f mongodb-service.yaml
Configuring the app to expose metrics
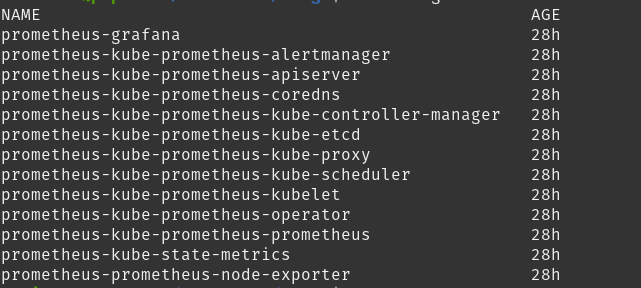
To expose the Mongodb app metrics to Prometheus, we need to configure its Exporter and Service Monitor. The Exporter is responsible for accessing the metrics for a certain application and presenting them in a format that Prometheus can understand. The Service Monitor, on the other hand, helps Prometheus identify the endpoints to scrape from. To see all the current Service Monitors, we can run: kubectl get servicemonitor
To check and see that they're visible to Prometheus, we can look at the Prometheus UI. To see the Prometheus UI, run this command - kubectl port-forward svc/prometheus-kube-prometheus-prometheus 9090. Once you do this, visit localhost:9090 on your browser and then go to Status -> Targets at the top of the page. You'd get a page like this:
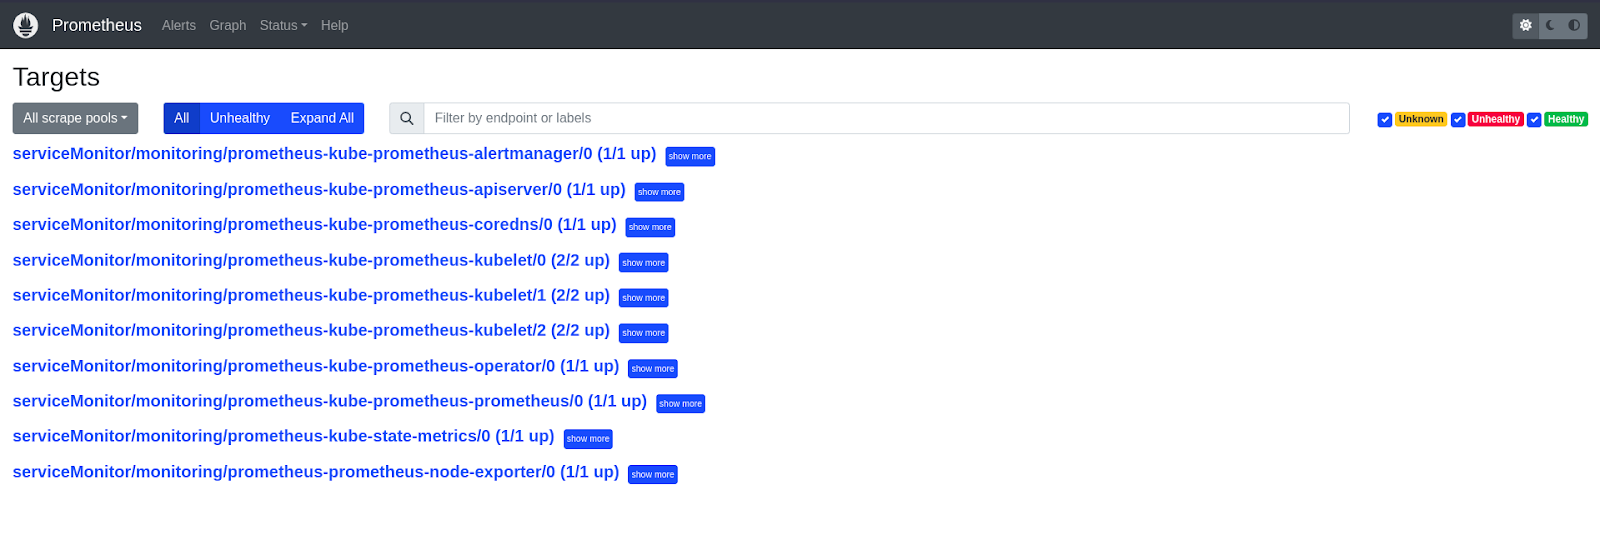
Here, you can see that the targets are precisely the same as the Service Monitors above. We need to make sure that our app's service monitor is displayed here so that Prometheus knows about our app's service, from which it needs to scrape metrics.
To install our app's Service Monitor and Exporter bundled together, we will be applying the prometheus-mongodb-exporter helm chart. Before we apply the helm chart, though, we will have to configure our chart to point to our app's service endpoint. We'll do so by saving the chart locally to apply it later on by running the command below on our terminal.
helm show values prometheus-community/prometheus-mongodb-exporter -o yaml > mongodb-exporter.yaml
Then, inside the exporter file, we will:
- Add this mongodb service uri to mongodb.uri in the yaml: "mongodb://mongodb-service:27017"
- Change the serviceMonitor.enabled label to true
- Lastly, add the release: prometheus label to serviceMonitor.additionalLabels
So, this is what you should have inside the mongodb-exporter.yaml file:
mongodb:
uri: "mongodb://mongodb-service:27017"
serviceMonitor:
enabled: true
additionalLabels:
release: prometheus
helm install mongodb-exporter prometheus-community/prometheus-mongodb-exporter -f mongodb-exporter.yaml
This should set up your Service Monitor and Exporter stack. You can check the Prometheus UI to see the monitor showing up under the targets list

Monitoring metrics using Grafana
Now that we have our Service Monitor , we can visualize our metrics on a Grafana dashboard. Run the following to access Grafana on your browser:
kubectl port-forward deployment/prometheus-grafana 3000
Now, visit localhost:3000 on your browser, and you'll be guided to the Grafana login page. Type in admin as the username and prom-operator as the password.
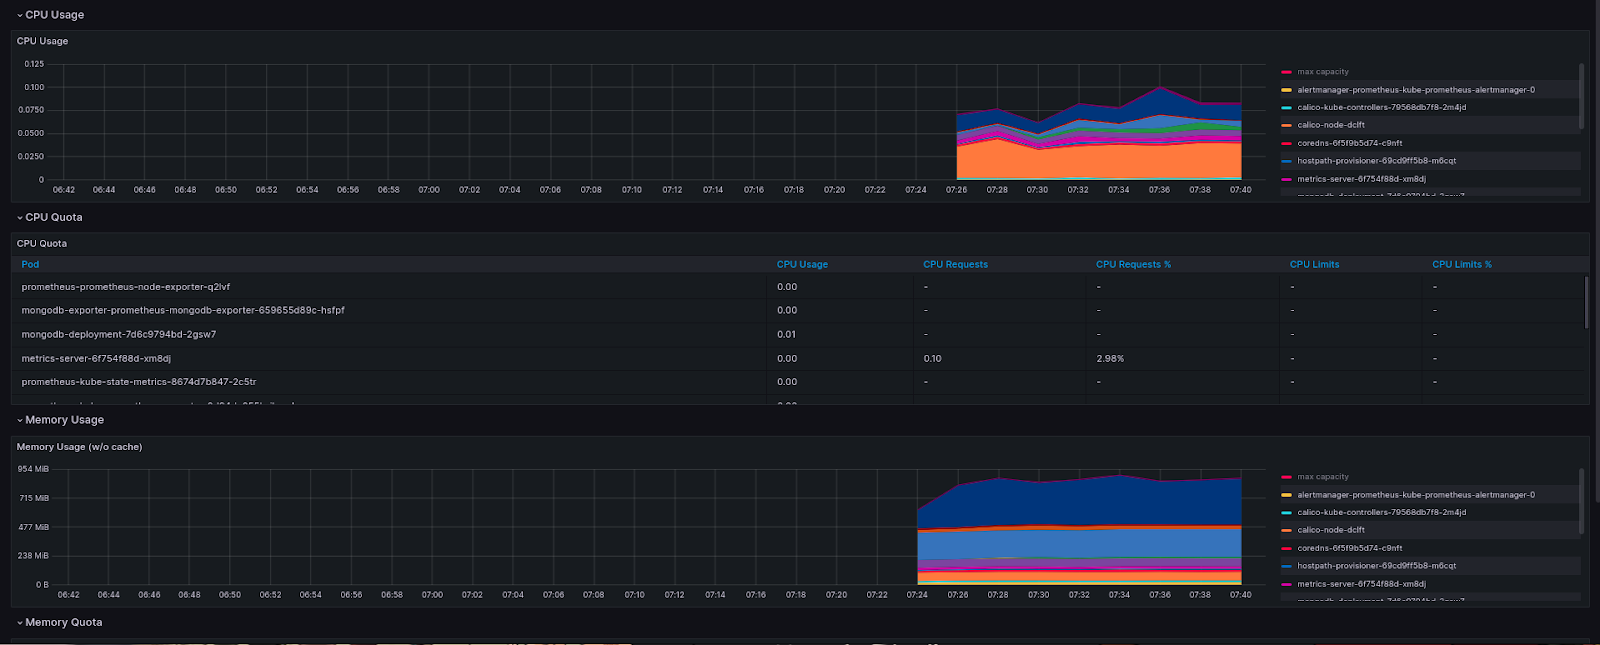
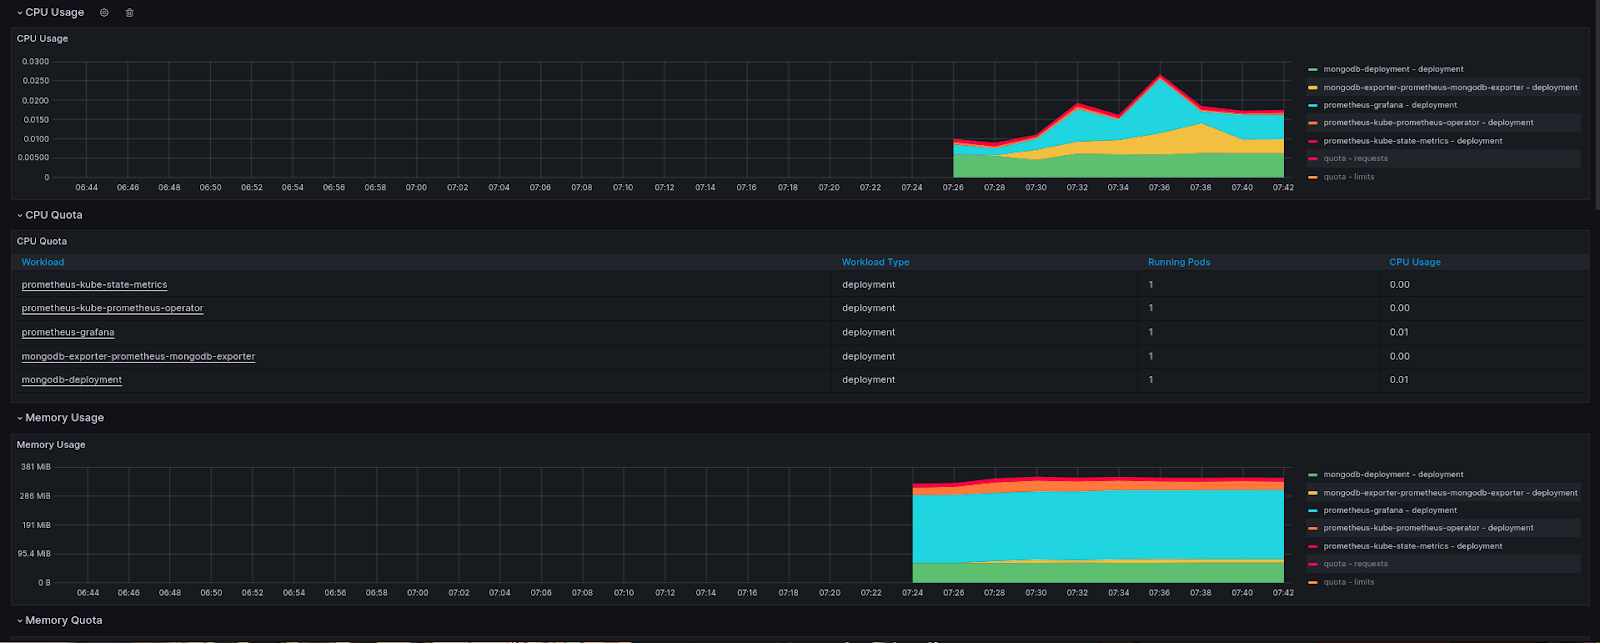
Go to Home -> Dashboards and select "Kubernetes / Compute Resources / Pod". Once you're on the dashboard page, select the Data source as Prometheus, namespace as monitoring, and pod as the Mongodb pod name from your cluster. You should now see dashboards similar to the ones I’ve added below:

Setting up an alert
Now that we can monitor our Mongodb pod, we can go ahead and create an alert for it. To do this, go to the Dashboard -> Alert rules -> Create alert rule. Then, on the page, name your alert as "Mongodb-alert" and choose the Grafana managed alert. Inside block A, choose Prometheus as the data source and paste the following as the alert query:
mongodb_ss_opcounters{pod="mongodb-exporter-prometheus-mongodb-exporter-659655d89c-hsfpf"}
For block B, choose the type classic_conditions, and within the condition, enter the following:
- WHEN: count()
- OF: A
- IS ABOVE: 10000
This is what your screen should look like
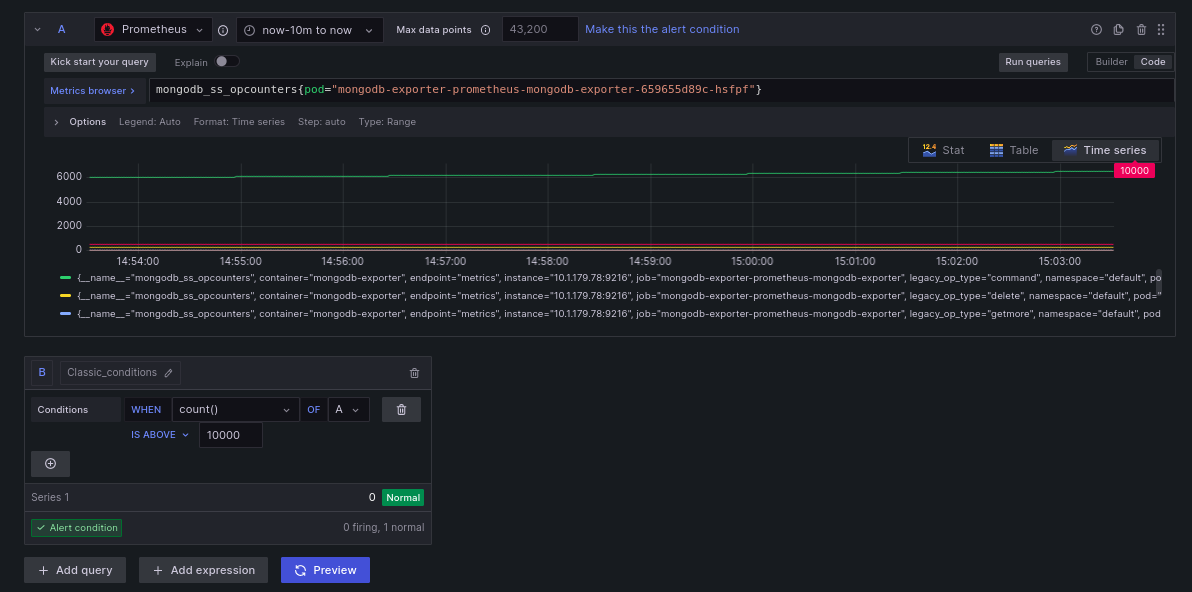
What this alert does is check for the opcounters metric (which records the number of database operations) such that now you get an alert whenever the total count of the database operations crosses 10000. Enter the following to better categorize your alert and to specify how often it is evaluated.

Add details within this block to better explain the alert to the user.

Finally, save your alert. Now, you successfully have an alert to notify you whenever database operations cross a limit of 10000.
Conclusion
Setting up alerts enables you to detect and respond to issues proactively, ensuring the smooth operation of your applications. In this article, you learned about setting up Kubernetes monitoring for a cluster using Prometheus and how to use Grafana to visualize these metrics on interactive dashboards to understand your cluster's behavior better.
By adopting a proactive monitoring approach, you can ensure your production systems' reliability, performance, and availability, leading to a better experience for both users and developers.