DocsTelepresence
Monitoring
Monitoring
Telepresence offers powerful monitoring capabilities to help you keep a close eye on your telepresence activities and traffic manager metrics.
Prometheus Integration
One of the key features of Telepresence is its seamless integration with Prometheus, which allows you to access real-time metrics and gain insights into your system's performance. With Prometheus, you can monitor various aspects of your traffic manager, including the number of active intercepts and users. Additionally, you can track consumption-related information, such as the number of intercepts used by your developers and how long they stayed connected.
To enable Prometheus metrics for your traffic manager, follow these steps:
Configure Prometheus Port
First, you'll need to specify the Prometheus port by setting a new environment variable called
PROMETHEUS_PORTfor your traffic manager. You can do this by running the following command:Validate the Prometheus Exposure
After configuring the Prometheus port, you can validate its exposure by port-forwarding the port using Kubernetes:
Access Prometheus Dashboard
Once the port-forwarding is set up, you can access the Prometheus dashboard by navigating to
http://localhost:9090in your web browser:Here, you will find a wealth of built-in metrics, as well as custom metrics (see below) that we have added to enhance your tracking capabilities.
Name Type Description Labels agent_countGauge Number of connected traffic agents. client_countGauge Number of connected clients. active_intercept_countGauge Number of active intercepts. session_countGauge Number of sessions. tunnel_countGauge Number of tunnels. tunnel_ingress_bytesCounter Number of bytes tunnelled from clients. tunnel_egress_bytesCounter Number of bytes tunnelled to clients. active_http_request_countGauge Number of currently served HTTP requests. active_grpc_request_countGauge Number of currently served gRPC requests. connect_countCounter The total number of connects by user. client,install_idconnect_active_statusGauge Flag to indicate when a connect is active. 1 for active, 0 for not active. client,install_idintercept_countCounter The total number of intercepts by user. client,install_id,intercept_typeintercept_active_statusGauge Flag to indicate when an intercept is active. 1 for active, 0 for not active. client,install_id,workloadEnable Scraping for Traffic Manager Metrics To ensure that these metrics are collected regularly by your Prometheus server and to maintain a historical record, it's essential to enable scraping. If you're using the default Prometheus configuration, you can achieve this by specifying specific pod annotations as follows:
These annotations instruct Prometheus to scrape metrics from the Traffic Manager pod, allowing you to track consumption metrics and other important data over time.
Grafana Integration
Grafana plays a crucial role in enhancing Telepresence's monitoring capabilities. While the step-by-step instructions for Grafana integration are not included in this documentation, you have the option to explore the integration process. By doing so, you can create visually appealing and interactive dashboards that provide deeper insights into your telepresence activities and traffic manager metrics.
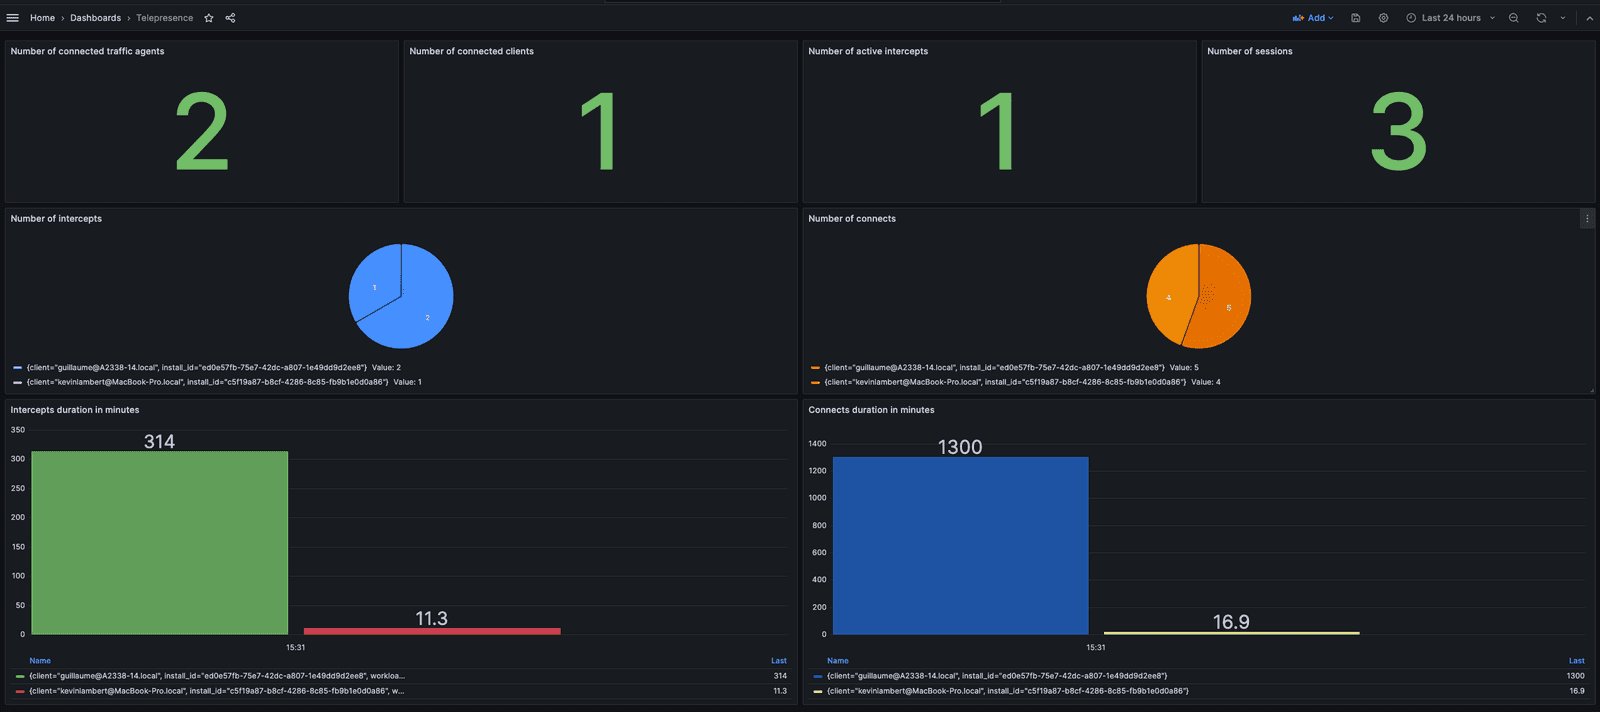
Moreover, we've developed a dedicated Grafana dashboard for your convenience. Below, you can find sample screenshots of the dashboard, and you can access the JSON model for configuration:
Sample Screenshots:
JSON Model:
This dashboard is designed to provide you with comprehensive monitoring and visualization tools to effectively manage your Telepresence environment.
ON THIS PAGE


