Service Mesh Introduction
Welcome to Service Mesh Fundamentals. Over the past few years, we’ve helped dozens of organizations deploy service mesh to production, and we’ve seen a lot of confusion about service mesh. So, we’ve written this ebook to address first-hand the questions we’ve heard and seen daily in helping these other organizations deploy service mesh to make sure you understand the fundamental concepts.
As a member of the CNCF community, we’ve contributed projects such as Telepresence and Edge Stack API Gateway to the CNCF. We’ve also contributed to CNCF projects such as Kubernetes and Envoy Proxy. As such, we’ve had a front-row seat to the rapid evolution of service mesh and its related ecosystem.
We’ve seen a lot of questions around service mesh and confusion, so we’ve decided to focus on the fundamentals of a service mesh: cloud-native application architecture and resilience patterns. Understanding distributed systems and why they’re more complex is critical to understanding the need for a service mesh. We’ll then talk about data planes and control planes and how service mesh is architected.
Chapter 1: Cloud-Native Apps
In this chapter, we’re going to discuss cloud-native applications. A cloud-native app has been designed and written specifically to run in the cloud and take advantage of this type of infrastructure's properties. An organization can consider itself “cloud native” when it has adopted supporting DevOps workflows and practices to enable greater agility, increased speed, and reduced issues for both the app and the organization.
In common cloud-native app architectures, each cloud-native app is composed of many loosely coupled and highly cohesive microservices working together to form a distributed system. Loosely coupled means an individual microservice can be changed internally without impacting other microservices. Highly cohesive microservices are built around a well-defined business context, and any modifications required are typically focused on a single area of responsibility or functionality.
Cloud-native applications are often packaged and run in containers. The underlying cloud infrastructure often runs on shared commodity hardware that is regularly changing, restarting, or failing. This means that a microservice should be designed to be temporary. It should start quickly, locate its dependent network services rapidly, and fail fast.
Dividing an app into numerous microservices increases its flexibility and scalability, but the potential downside is reduced availability due to the app’s increased complexity and dynamic nature. There are also concerns about the app’s security and observability--being able to monitor its state--when an app is divided into more pieces. We’ll look at ways to address these concerns in later chapters.
Now let’s take a closer look at cloud-native apps.
Introduction to Cloud-Native Apps
If an organization wants to become cloud-native, it doesn’t just mean that all its applications have been designed and written specifically to run in cloud environments. In addition, it also means that the organization has adopted development and operational practices that enable agility for both the app and the organization itself.
The cloud-native app architecture evolved in response to many of the common bottlenecks that slow down the development and release of monolithic applications, namely avoiding code “merge hell” that follows from a large number of engineers working around a single codebase, enabling independent release of individual services, and providing a limited area to investigate -- a blast radius -- when a component does fail. The cloud-native approach enables development and operational staff to rapidly make localized decisions related to their defined responsibilities and carry those decisions out.
DevOps workflows combine software development and operations to enable faster, more frequent software releases with a lower rate of failure, aiming to achieve the principle of continuous delivery.
In common cloud-native app architectures, apps are typically written as several independent microservices, each performing a different function. The microservices are deployed and run within container technologies in the cloud. The microservices communicate across the cloud to collectively provide the app’s functionality, working together to form a distributed system.
Common Cloud-Native App Architectures
Before cloud-native apps, an app’s architecture was often a single “monolithic” entity that consisted of a single service providing many functions. The cloud-native approach means that instead of being a single service, the app comprises multiple microservices, each performing a well-defined single function or small set of functions
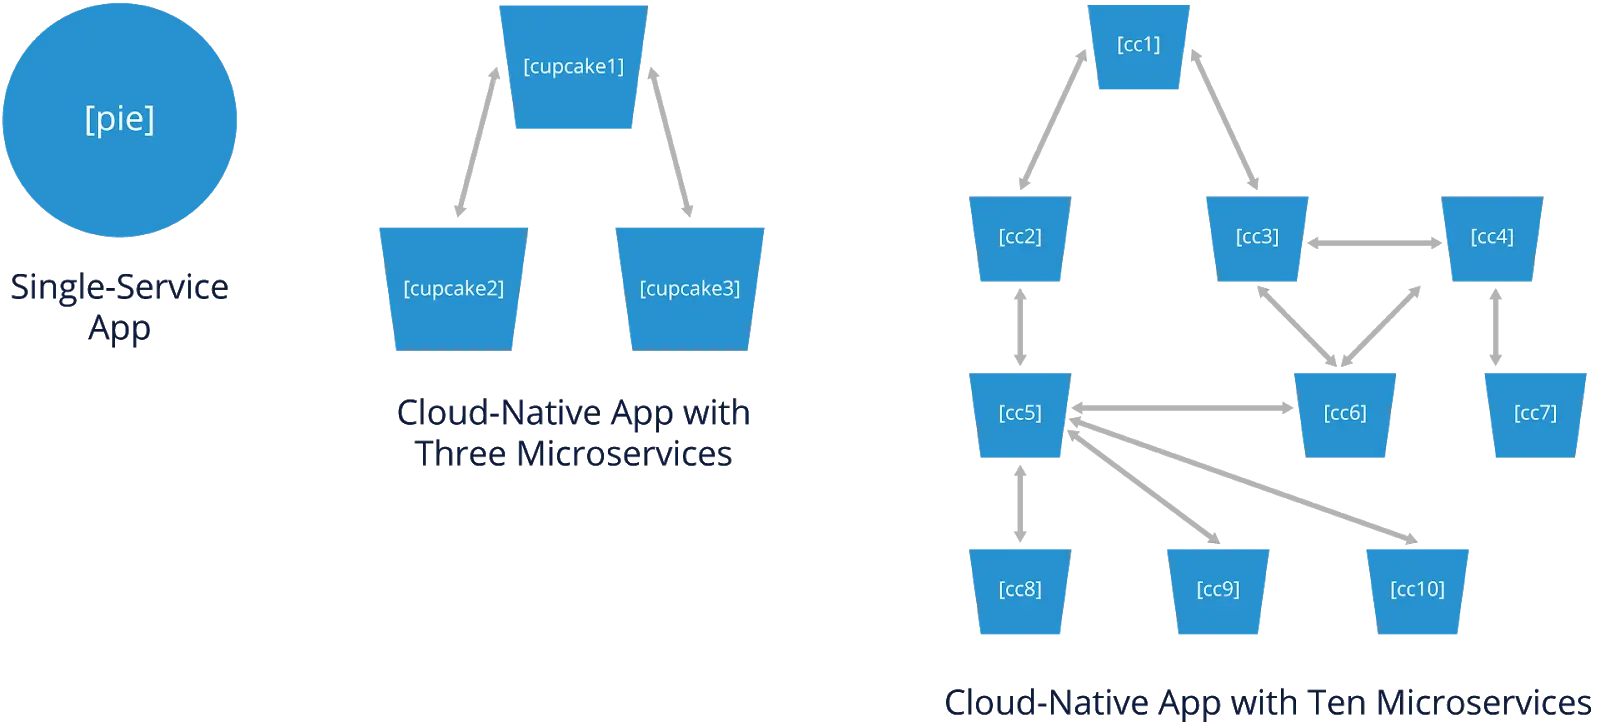
The diagram below shows two examples: a single-service app, and a cloud-native app comprising three microservices. The single-service app is depicted by a pie, reflecting that the app is a single entity that must be made as a whole. The cloud-native app is depicted as cupcakes, meaning that each cupcake (microservice) is independent of the others and can have a different recipe (language, etc.).
Each microservice is decoupled from the others, meaning that any microservice can be changed internally without needing to change any other microservices. So you can change the recipe for one cupcake without changing the recipes for the others. With a pie, changing the recipe affects the whole pie.
Most microservices are also designed to be ephemeral, meaning that they can safely and rapidly stop and start at an arbitrary time. For example, an underlying virtual machine that a service is running on may restart, triggering a restart of all the processes and applications running on that VM.
In the cloud-native app, two microservices communicate with the third microservice. The single-service app and the cloud-native app can provide the same functionality.

Next Steps
Edge Stack API Gateway delivers the scalability, security, and simplicity for some of the world's largest Kubernetes installations.
The diagram below adds a third example: an app with ten microservices, each independent of the others, depicted as ten different types of cupcakes. This hints at how much more complex a cloud-native app’s architecture could be. For example, some of the microservices are communicating with more than one other microservice. All 10 microservices are part of a single distributed system. Each of the 10 microservices can be anywhere, as long as it can communicate with the others it needs to.
Cloud-Native App Benefits
From a developer's viewpoint, the primary benefit of cloud-native apps over other apps is that each part of the cloud-native app can be developed and deployed separately from the others. This enables faster development and release of apps. Also, returning to the pie versus cupcake analogy, in cloud-native apps, each microservice can be customized and tailored to meet specific needs. Customizing one cupcake doesn’t affect the others.
To illustrate the benefits for developers, let’s look at two scenarios.
Scenario 1: Suppose a cloud-native app consists of 10 microservices, each developed by a different team and loosely coupled with the others. If one of those teams wants to add a new feature, it revises its microservice, and then the updated microservice can be shipped immediately, thus achieving continuous delivery.
The same is true for all teams in this scenario, so no team will be delayed because they have to wait for another team to work on something unrelated.
Scenario 2: Suppose that a single-service app provides the same functionality as the cloud-native app from Scenario 1. Ten teams develop parts of the single-service app. If one of those teams wants to add a new feature, it has to wait until the next scheduled release of the app, which depends on the other teams completing their current development work and whether or not their work is related to the first team’s.
For the first team, there could be a delay of days, weeks, or months before their new feature finally ships. Delays from one team will affect all other teams--one team needing to catch up on schedule could keep all others from releasing their new features.
So, cloud-native apps allow organizations to be more agile and innovative, taking advantage of new opportunities immediately.
From an operations viewpoint, the primary benefit of cloud-native apps is that each microservice comprising the cloud-native app can be easily deployed, upgraded, and replaced without adversely affecting the other parts of the app. Each microservice should be independently releasable and deployable.
Additional copies of each microservice can be deployed or retired to scale the app up or down to meet demand. New microservice versions can be rolled out, and users can transition to them without an entire app outage. Copies of the same microservice can also be running in multiple clouds.
If developers follow established cloud-native best practices, such as designing applications to support Heroku’s Twelve Factor App principles, this further increases the operability of applications. Examples include:
- Treating backing services (database, messaging, caching, etc.) as attached resources.
- Executing the application as one or more stateless processes.
- Maximizing robustness with fast startup and graceful shutdown.
The Fallacies of Distributed Computing
As mentioned earlier in this chapter, cloud-native applications are typically decomposed into individual microservices. This decomposition of business logic results in a distributed system, as the microservices need to communicate with each other over a network for the application to function.
Decades ago, Peter Deutsch and his colleagues at Sun Microsystems created a list of the fallacies of distributed computing. (https://web.archive.org/web/20160909234753/https://blogs.oracle.com/jag/resource/Fallacies.html) It pointed out that people often make incorrect assumptions when transitioning from non-distributed to distributed models.
Cloud-native apps--and the cloud, for that matter--didn’t exist when that list of fallacies was compiled. Several of those fallacies are potentially relevant to cloud-native app adoption today, including the following:
- “The network is reliable.
- Latency is zero.
- Bandwidth is infinite.
- The network is secure.”
Things can and will go wrong with any app, but there are more opportunities for failures with distributed apps than non-distributed ones.
Common Challenges for Cloud-Native Apps
Let’s look closely at some common challenges cloud-native apps can pose.
The first of these challenges is being able to find all the microservices that are dynamically deployed. As microservices are migrated from one place to another, and additional instances of microservices are deployed, it becomes increasingly difficult to keep track of where all the instances are currently deployed at any given time. This challenge is commonly referred to as service discovery.
A second challenge involves security and observability. Cloud-native apps are inherently more complex. This makes them harder to secure because they have larger attack surfaces and more logical pieces to protect. This also makes it harder to monitor how the app operates and understand what happens when things go wrong, especially for app debugging purposes.
With an application built using a monolithic architecture, a crash in one component typically crashes the entire application. A microservice-based architecture enables an isolated collision in one service, thus limiting the blast radius and preventing the whole application from crashing. However, a failure in one service can cascade throughout the application if mishandled. The more services there are, the more chance of a partial failure turning into a system failure, which decreases availability and increases the application’s downtime.
Take another look at the diagram we examined earlier, and think about it in the context of each challenge.
Chapter 2: Resilience for Distributed Systems
In this chapter, we will talk about resilience for distributed systems.
A cloud-native app architecture composed of several microservices working together forms a distributed system. Ensuring the distributed system is available and reduces downtime necessitates increasing the system’s resilience. Resilience is the use of strategies for improving availability. Examples of resilience strategies include load balancing, timeouts and automatic retries, deadlines, and circuit breakers.
Resilience can be added to the distributed system in more than one way. For example, having each microservice’s code include calls to code libraries with resilience functions or having special network proxies handle microservice requests and replies. The ultimate goal of resilience is to ensure that failures or degradations of particular microservice instances don’t cause cascading failures that cause downtime for the entire distributed system.
In the context of a distributed system, resilience is about the system being capable of automatically adapting when adverse situations occur to continue to serve its purpose.
The terms “availability” and “resilience” have different meanings. We discussed availability in the previous chapter: the percentage of time that a distributed system is up. Resilience is the use of strategies for improving a distributed system’s availability.
One of the primary goals of resilience is to prevent situations where an issue with one microservice instance causes more issues, which escalate and eventually lead to distributed system failure. This is known as a cascading failure.
Resilience Strategies
Resilience strategies for distributed systems are usually employed at multiple OSI model layers, as shown in the graphic. For example, the physical and data link layers (layers 1 and 2) involve physical network components, like connectivity to the Internet, so the data center and cloud service providers would be responsible for selecting and implementing resilience strategies for those layers.
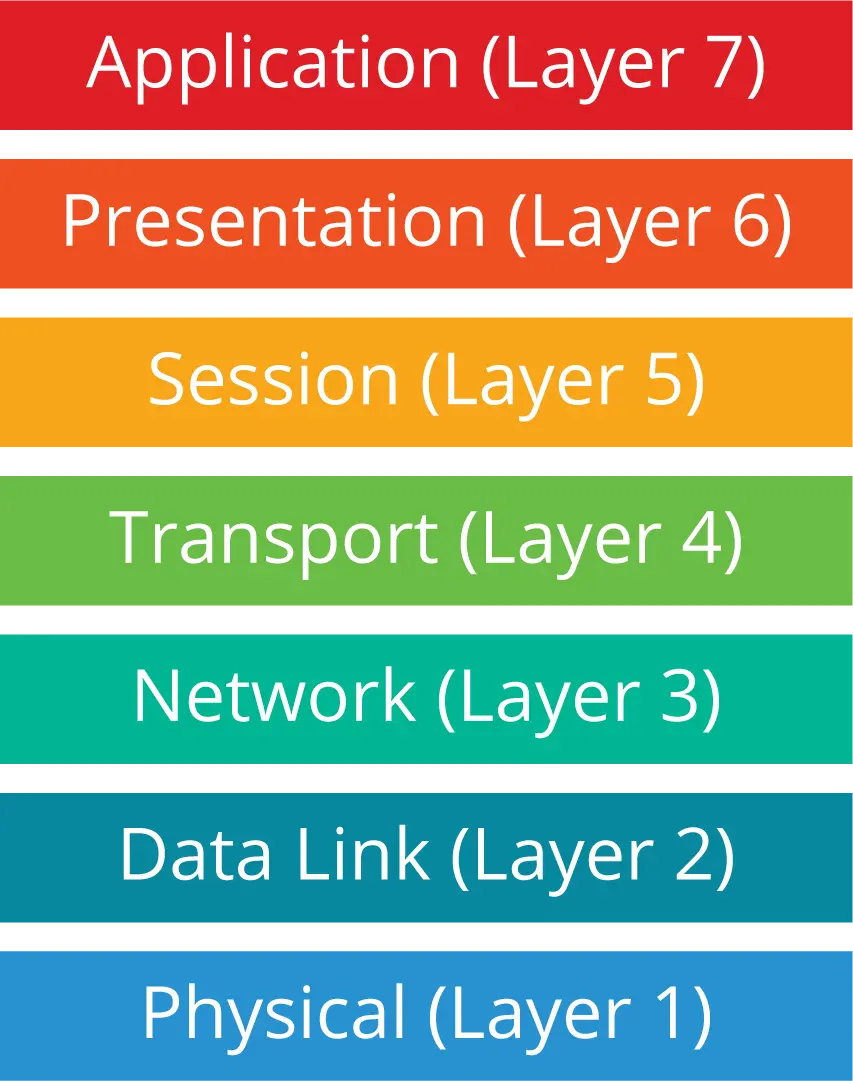
The application layer is where applications reside; this is the layer that human users (as well as other applications) directly interact with. Application-level (layer 7) resilience strategies are built into the microservices themselves.
An organization's developers could design and code an app to continue to work in a degraded state, providing vital functions even when other functions have failed due to bugs, compromises, or other issues with one or more of the microservices. An example of this type of functionality can be seen within the recommendations functionality on popular video streaming applications. The home page usually contains personalized recommendations, but if the associated backend components fail, a series of generic recommendations are shown instead. This failure does not impact your ability to search for and play a video.
The transport layer (layer 4) provides network communication capabilities, like ensuring reliable delivery of communications. Network-level resilience strategies work at layer 4 to monitor the network performance of deployed instances of each microservice, and they direct requests for microservice usage to the best instances. For example, if a particular microservice instance stops responding to requests because of a failure at its location (say, a network outage), new requests would automatically be directed to other microservice instances.
An organization deploying a cloud-native app as a distributed system should consider resilience strategies at the network and application levels. In this chapter, we'll examine four such types of strategies for cloud-native apps:
- Load balancing
- Timeouts and automatic retries
- Deadlines
- Circuit breakers
Load balancing, timeouts, and automatic retries support redundancy for the components of the distributed system. Deadlines and circuit breakers help reduce the effect of degradation or failure of any part of the distributed system.
Load Balancing
Load balancing for cloud-native apps can be performed at multiple OSI model layers. Like the resilience strategies we discussed, load balancing can be performed at layer 4 (the network or connection level) or layer 7 (the application level).
For Kubernetes, layer 4 load balancing is, by default, implemented using kube-proxy. It balances the load at a network connection level. Managing Pod IP addresses and traffic routing between virtual/physical network adapters is handled via the Container Networking Interface (CNI) implementation or an overlay network, such as Calico or Weave Net. Covering the topic of CNI and overlay networks is outside this ebook's scope.
Returning to layer 4 load balancing, suppose that one network connection sends a million requests per second to an app, and another is sending one request per second to the same app. The load balancer is unaware of this difference; it simply sees two connections. If it sent the first connection to one microservice instance and the second connection to a second one, it would consider the load to be balanced.
Layer 7 load balancing is based on the requests, not the connections. A layer 7 load balancer can see the requests within the connections and send each request to the optimal microservice instance, which can provide better balancing than a layer 4 load balancer can. In the rest of this ebook, we always mean layer 7 load balancing when we say "load balancing." Also, while layer 7 load balancing can be applied to services or microservices, in this ebook, we focus on using it for microservices only.
For cloud-native apps, load balancing refers to balancing the app's requests amongst the running instances of the microservices. Load balancing assumes more than one instance of each microservice; having multiple instances of each provides redundancy. The instances are distributed whenever feasible, so if a particular server or site goes down, not all instances of any microservice will become unavailable.
Ideally, there should be enough instances of each microservice so that even when failures occur, like site outages, there are still enough instances of each microservice available that the distributed system continues to function properly for all who need it at that time.
Load Balancing Algorithms
There are many algorithms for performing load balancing. Let's take a closer look at three of them.
- Round robin is the simplest algorithm. The instances of each microservice take turns handling requests. For example, if microservice A has three instances--1, 2, and 3--the first request would go to instance 1, the second to instance 2, and the third to instance 3. Once each microservice has received a request, the next request would be assigned to instance 1 to start another cycle through the instances.
- The least request is a load-balancing algorithm that distributes a new request to the microservice instance with the fewest requests pending at the time. For example, suppose microservice B has four instances, and instances 1, 2, and 3 handle 10 requests right now, but instance 4 only handles two requests. With a least request algorithm, the next request would be instance 4.
- Session affinity, also known as sticky sessions, is an algorithm that attempts to send all requests within a session to the same microservice instances. For example, if user Z is using an app and that causes a request to be sent to instance 1 of microservice C, then all other requests for microservice C in that same user session will be directed to instance 1.
There are numerous variants of these algorithms--for example, weighting is often added to round-robin and least request algorithms so that some microservice instances receive a larger or smaller share of the requests than others. For example, you might want to favor microservice instances that typically process requests more quickly than others.
In practice, load balancing algorithms alone often need to provide more resilience.
For example, they will continue to send requests to microservice instances that have failed and no longer respond to requests. This is where adding strategies like timeouts and automatic retries can be beneficial.
Timeouts and Automatic Retries
Timeouts are a fundamental concept for any distributed system. If one part of the system makes a request and another part fails to handle that request in a certain period, the request times out. The requester can then automatically retry the request with a redundant instance of the failed part of the system.
For microservices, timeouts are established and enforced between two microservices. If a microservice A requests an instance of microservice B and the microservice B instance doesn't handle it in time, the request times out. The microservice A instance can then automatically retry the request with a different instance of microservice B.
No guarantee retrying a request after a timeout will succeed. For example, if all instances of microservice B have the same issue, a request to any of them might fail. But if only some instances are affected--for example, an outage at one data center--then the retry is likely to succeed.
Also, requests should only sometimes be automatically retried. A common reason is to avoid accidentally duplicating a transaction that has already succeeded. Suppose that a request from microservice A to microservice B was successfully processed by B, but its reply to A was delayed or lost. It's fine to reissue this request in some cases but not in others.
- A safe transaction is one where the same request causes the same result. This is similar to a GET request in HTTP. A GET is a safe transaction because it retrieves data from a server but does not cause the data on the server to be altered. Reading the same data more than once is safe, so reissuing a request for a safe transaction should be fine. Safe transactions are also called idempotent transactions.
- An unsafe transaction is one where the same request causes a different result. For example, HTTP, POST, and PUT requests are potentially unsafe transactions because they send data to a server. Duplicating a request could cause the server to receive that data more than once and process it more than once. If the transaction is authorizing a payment or an order, you certainly want to avoid having it happen too many times.
Deadlines
In addition to timeouts, distributed systems have distributed timeouts or, more commonly, deadlines. These involve more than two parts of the system. Suppose four microservices rely on each other: A sends a request to B, which processes it and sends its request to C, which processes it and sends a request to D. The replies flow the other way, from D to C, C to B, and B to A.
The figure below depicts this scenario. Suppose that microservice A needs a reply to its request within 2.0 seconds. With a deadline, the time remaining to fulfill the request travels with the intermediate requests. This enables each microservice to prioritize the processing of each request it receives, and when it contacts the next microservice, it will inform that microservice how much time is remaining.

Circuit Breakers
Timeouts and deadlines address each request and reply within the distributed system individually. Circuit breakers have more of a “big picture” view of the distributed system. Suppose a particular instance of a microservice is not replying to requests or is replying to them more slowly than expected. In that case, the circuit breaker can cause subsequent requests to be sent to other instances.
A circuit breaker limits the degree of service degradation or failures for a single instance of a microservice. When an instance exceeds that level, this trips the circuit breaker and causes the microservice instance to stop being used temporarily.
The goal of a circuit breaker is to prevent an issue with one microservice instance from negatively affecting other microservices and potentially causing a cascading failure. Once the issue has been resolved, the microservice instance can be used again.
Cascading failures often start because of automatic retries directed at microservice instances experiencing degradation or failure. Suppose you have a microservice instance that’s overwhelmed with requests, causing it to reply slowly. If a circuit breaker detects this and temporarily stops new requests from going to the instance, the instance can catch up on its requests and recover.
But if a circuit breaker doesn’t act and new requests keep going to the instance, that instance may fail. That forces all the requests to go to other instances. If those instances were already near capacity, the new requests may overwhelm them too and eventually cause them to fail. This cycle continues, and eventually the entire distributed system fails.
Implementing Resilience Strategies with Libraries
So far we’ve talked about several resilience strategies, including three forms of load balancing plus timeouts and automatic retries, deadlines, and circuit breakers. Now, it’s time to start thinking about how these strategies can be implemented.
When microservices were first being deployed, the most common way to implement resilience strategies was to have each microservice use a standard library that supported one or more of the strategies. An example was Hystrix, an open source library that added resilience features to distributed systems. Developed by Netflix until 2018, Hystrix calls could be wrapped around any call within a microservice that relied on a request to another microservice. Another example of a resilience library is Resilience4j, which is intended for functional programming with Java.
Implementing resilience strategies through application libraries can certainly be viable, but it doesn’t work for every situation. Resilience libraries are language-specific, and microservice developers typically use the best language for each microservice, so a resilience library might not support all the necessary languages. To use the resilience library, developers might have to write some microservices in languages that provide less-than-desirable performance or have other significant shortcomings.
Another concern is that relying on libraries means adding call wrappers to every susceptible call in every microservice. Some calls might be missed, some wrappers might contain errors, and having all the microservices developers do things consistently is a challenge. There are also maintenance issues--every new developer who works on the microservices in the future will have to be aware of the call wrappers.
Implementing Resilience Strategies with Proxies
Over time, library-based implementations of resilience strategies have been supplanted by proxy-based implementations. We’ll be discussing the use of proxies throughout the rest of this ebook, so we’ll establish the foundation for that here.
Generally speaking, a proxy sits in the middle of communications between two parties and provides some service for those communications. Proxies often provide some degree of separation between the two parties. For example, party A requests party B, but that request goes from A to the proxy, which processes the request and sends its own request to B. A and B don’t directly communicate with each other.
The figure below shows an example of this flow of communications. One session is between an instance of microservice A and its proxy, and a separate session is happening between A’s proxy and an instance of microservice B. The A-to-proxy and proxy-to-B sessions collectively provide the communications between A and B.

In distributed systems, proxies can implement resilience strategies between the instances of microservices. To continue the previous example, when an instance of microservice A sends a request to microservice B, that request goes to a proxy. The proxy would process A’s request and decide which instance of microservice B it should go to, and then it would issue the request on A’s behalf.
The proxy would monitor for a reply from the B instance. If the reply was not received promptly, it could automatically retry the request with a different microservice B instance. In the figure, the proxy for microservice A has three instances of microservice B to choose from, and it selects the third one. If the third one does not respond quickly enough, the proxy can use the first or second instance instead.
The primary advantage of proxy-based resilience is that the individual microservices do not need to be modified to use special libraries; any microservices can be proxied. There are other advantages as well. We’ll examine those in the coming chapters.
Chapter 3: Service Mesh Data Planes and Control Planes
In this chapter, we will talk about service mesh data planes and control planes.
The data plane consists of one or more service proxies within a cluster, each of which typically runs next to a single service or microservice of an app. The data plane is responsible for the microservices' service discovery, resilience, observability, and security. It does this by directly managing and manipulating traffic. The control plane defines policy and ensures the data plane follows that policy. It manages and coordinates the data plane to form a distributed system.
The control plane and the service proxies it manages, when considered together, collectively are an architectural pattern. A service mesh is one implementation of that pattern. A service mesh handles an app’s service-to-service, or “east-west”, traffic within a cluster. A service mesh typically interacts with an Ingress controller, which manages the app’s ingress, or “north-south”, traffic entering the cluster.
Data Planes
In Chapter 2, we talked about proxies. Network traffic passes through proxies, providing features that inspect or manipulate the traffic. In the context of a service mesh, a data plane is a group of proxies, each one dedicated to one of the app’s services or microservices. Each proxy within the data plane is known as a service proxy (sometimes called a service mesh proxy.) Service proxies are also called sidecar proxies because they are deployed and run out-of-process alongside a service or microservice, and the service or microservice doesn’t directly control the proxy.
Note: Service proxies can be used with either services or microservices--or even monolithic apps--but most cloud-native apps use microservices. Accordingly, throughout the rest of this chapter, for brevity, we will refer to “microservices” instead of “services or microservices.”
The figure below shows a simplified example of a cloud-native app comprised of three microservices: A, B, and C. Each microservice has a corresponding service proxy, and it only talks directly to its service proxy within its pod. This is shown by the blue arrows in the figure between the service proxies and the microservices.
The arrowheads indicate which entities can initiate communications; for the blue arrows, the double arrowheads mean that the service proxy can initiate communications to its microservice, and the microservice can initiate communications to its service proxy.
Each service proxy performs all communications with the other service proxies (and indirectly with their microservices) on behalf of its microservice. These communications are typically in remote procedure calls (RPCs). The red arrows in the figure depict this: communications between the service proxy for A and the service proxy for B, and between the service proxy for B and the service proxy for C.
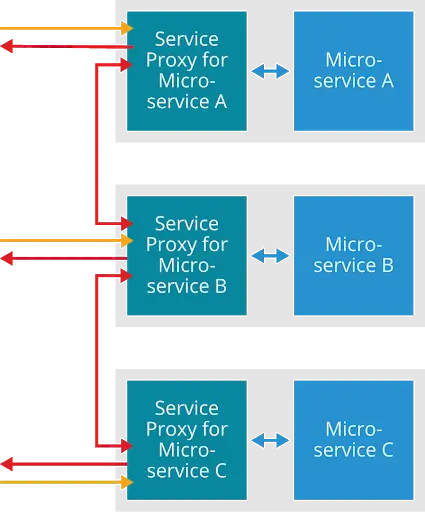
Notice that there are arrows originating with each service proxy and pointing outward and that these arrows only go in one direction. These show that the service proxies have egress capabilities. We’ll talk more about egress later in this chapter.
The orange arrows show that the service proxies can also accept incoming requests from elsewhere. A service proxy is actually both a proxy and a reverse proxy. We think about proxies first and foremost as handling incoming requests destined for a particular app microservice. However, a service proxy also handles outgoing requests from its app’s microservice to its other microservices. The first part--handling the incoming requests--is a proxy. The second part--handling the outgoing requests--is a reverse proxy. For brevity, people say a service proxy is a proxy, but it’s truly both a proxy and a reverse proxy.
Implementing features in the data plane means they don’t have to be implemented in each microservices. It also means the features will be implemented consistently throughout the app, regardless of the programming languages used to implement each service.
This graphic only depicts part of a service mesh. Another element is the control plane--it manages and coordinates the service proxies. You’ll learn more about control planes later in this chapter.
Service Proxy Features
Service proxies provide features between the microservices comprising a cloud-native app within a Kubernetes cluster. These features usually include the following:
- Service discovery: When a microservice needs to request another microservice, the first microservice’s service proxy needs to find an instance of the second microservice that can handle the request. In some cases, the instance also needs to have particular characteristics or attributes. Service discovery is a significant undertaking in a dynamic, distributed system with large numbers of microservices.
- Resilience: These may include implementing any or all of the resilience strategies for traffic management discussed in Chapter 3, like load balancing, timeouts, deadlines, and circuit breakers, as well as others on behalf of the service proxy’s microservice. Resilience also includes verifying that the desired microservice instances are available and sending requests to the right place on behalf of the service proxy’s microservice.
- Observability: A service proxy can observe each request and reply that it receives. It can also collect telemetry data, such as on the performance or health of its microservice. Most importantly, it can collect metrics about the traffic itself, such as throughput, latency, and failure rates.
- Security: A service proxy can identify requests and replies that violate policies and stop them from being passed through. Other security features service proxies may provide authenticating the identity of other microservices and enforcing access control policies based on the authenticated identity.
If you think back to Chapter 1, these are the same common challenges that cloud-native apps often face: challenges with service discovery, resilience, observability, and security. Service proxies support features that address all of them.
Service Mesh Data Plane Solutions
Before sidecar-based proxies existed, some of the same features that service proxies provide today were built into language-specific resilience libraries, as discussed in Chapter 2. Twitter’s Finagle, Netflix’s Hystrix, and Google’s gRPC are examples of communication and resilience libraries designed to provide resilience for remote procedure calls between services.
Over time, solutions shifted from resilience libraries to out-of-process proxies that were Layer 7 aware (regarding the OSI networking model). These proxies had the same features for RPC resilience that the libraries had. One example of these proxies is HAProxy, which was used by AirBnB’s SmartStack in 2013. The first layer 7 proxy used for a full-fledged service mesh solution was the linked-proxy, followed shortly after that by Envoy Proxy.
Common service mesh data plane solutions include Envoy Proxy, linked-proxy, NGINX, and HAProxy. In this ebook, we’ll cover two popular choices in more detail: Envoy Proxy and linkerd-proxy.
Control Planes and Service Meshes
A control plane manages and coordinates the data plane, which is all the service proxies for an app within a cluster, to form a distributed system. The control plane doesn’t directly observe or affect any service requests or replies; requests and replies don’t pass through the control plane.
A person defines policies and configures the control plane, and the control plane then configures the data plane and monitors its state and the states of the service proxies comprising it. The control plane ensures every service proxy in the data plane follows the defined policies.
When considered together, the control plane and the data plane it manages are an architectural pattern. A service mesh is one implementation of that pattern. The service mesh resides inside a cluster, handling the app’s service-to-service, east-west network traffic. We’ll discuss another implementation of the control plane/data plane pattern later in this chapter.
This figure shows a simplified service mesh. The control plane interacts directly with each service proxy within the data plane. The orange dashed lines between the control plane and the service proxies indicate the control communications. The service proxies and their corresponding microservices form the data plane. For simplicity, this diagram only shows the control communications and not any of the data communications.

Service Mesh Technologies
Envoy Proxy is a popular choice for service meshes to use as their data plane. Let’s learn a little more about the history of Envoy Proxy from Matt Klein, Envoy’s architect. Originally developed by Lyft, Envoy Proxy is now a Cloud-Native Computing Foundation project, with hundreds of contributors from many companies such as AirBnb, Amazon, Microsoft, Google, Pinterest, and Salesforce.
Examples of Envoy-based service meshes include:
- Consul is an open source software project stewarded by HashiCorp.
- Istio is an open source project from Google, IBM, and Lyft.
- Kuma is a service mesh control plane implementation. Kuma is provided by Kong Inc.
linkerd is a non-Envoy-based service mesh that uses its own proxy, linked2-proxy. The Cloud Native Computing Foundation (CNCF) project hosts linkerd.
Ingress Controllers
A service mesh resides within a cluster and handles service-to-service, east-west traffic. However, the service mesh also needs a way for its microservices to reply to requests from users and other entities outside its cluster. With Kubernetes, each pod has its IP address, and each cluster effectively becomes a separate network from the Internet. So to route traffic to microservices inside a cluster, a special piece of infrastructure software is needed.
“ingress” generally refers to traffic coming into a network. In the context of Kubernetes, Ingress refers to the Ingress API object, which is responsible for routing and controlling inbound network traffic entering a Kubernetes cluster.
A pattern known as an Ingress controller performs this Ingress function in Kubernetes. The Ingress controller manages the app’s north-south traffic entering the cluster. Traffic from outside the cluster is sent to the Ingress controller, which routes the traffic to the appropriate services in the cluster.
Ingress controllers are also needed to route traffic into a service mesh when a service mesh is being used. The integration between an Ingress controller and a service mesh occurs at two levels:
- At the control plane level, the Ingress controller and service mesh must share service discovery information to route traffic to the correct target destination consistently.
- At the data plane level, the Ingress controller and service mesh share encryption secrets to secure all communications.
Some Ingress controllers also function as API Gateways. An API Gateway provides additional management capabilities above and beyond a typical Ingress controller. This functionality typically includes authentication, rate limiting, and API management capabilities.
Another pattern that can manage the north-south traffic entering the cluster is called an API gateway. Sometimes the terms “Ingress controller” and “API gateway” are used synonymously, but they often have different meanings. An Ingress controller is particular to Kubernetes. In the context of service mesh, an API gateway includes an Ingress controller. However, an API gateway performs other functions as well, and it’s not particular to Kubernetes. API gateways are used in many environments and for purposes other than Ingress control.
In this ebook, we’ll generally use the term “Ingress controllers” for brevity, but the term used in the context of service meshes includes API gateways providing Ingress controller functions.
Examples of Ingress controllers include:
- Edge Stack is a Kubernetes-native API gateway and Ingress controller built on Envoy Proxy.
- Contour is another open-source Ingress controller built on Envoy Proxy.
- ingress-nginx is an open-source Ingress controller built on NGINX.
Ingress Controller and Service Mesh Control Plane
An Ingress controller works in concert with the service mesh. Building on the previous figure, which showed a simplified service mesh, this figure adds three important elements:
- the Ingress data plane (the Ingress controller for the data plane), which is inside the cluster at its edge
- the Ingress control plane (the Ingress controller for the control plane), which is also inside the cluster
- the external load balancer, which is just outside the cluster and connects the cluster to the outside world
Notice that the external load balancer, the Ingress data plane, and the microservices are grayed out, and many arrows in the diagram have been grayed out. The grayed-out elements are used for data communications. We will set those aside for the time being, but we’ll return to them shortly.
For now, let’s focus on the boxes connected by dotted lines. The dotted lines represent control communications. As in the previous diagram, this figure shows control communications between the service mesh control plane and each service proxy in the data plane.
This diagram also shows control communications between the control and Ingress control planes. We’ll examine these communications in more detail later in this ebook. Still, basically, the service mesh control plane frequently updates the Ingress controller on the state of the microservices in its data plane. The Ingress controller uses that information to decide how to handle incoming requests entering the cluster from the external load balancer.

Ingress Controller and Service Mesh Data Plane
As mentioned earlier in this chapter, Ingress controllers also interact directly with the service mesh data plane. In this diagram, the control communications are grayed out, and the data communications are shown with blue arrows (between service proxies and their respective microservices only) and red arrows (for all other data communications).
This diagram has a lot going on, so let’s walk through an example. Suppose a microservice outside the cluster generated a request destined for a microservice inside the cluster.
- In step 1, that request would reach the external load balancer from the outside world. Examples of external load balancers include cloud load balancers such as Amazon Elastic Load Balancers, Google HTTP(S) Load Balancers, and Azure Standard Load Balancers.
- The external load balancer would send that request into its cluster in step 2, to be received by the cluster’s Ingress data plane.
- The Ingress data plane would route the request to the service proxy in step 3.
- The service proxy would receive the request and contact its microservice to handle it in step 4.
- The reply from the microservice would follow the same path out of the cluster to reach the microservice that generated the request.

Ingress controllers can also help protect the communications they receive from the outside world. For example, external clients may want to verify the identity of what they are connecting to and to ensure the information being carried over the connection is secured from eavesdropping and tampering by attackers. The protocol used to provide this security is called Transport Layer Security (TLS), and we’ll be discussing it more later in this ebook.
Ingress controllers provide a feature known as TLS termination. This is the process of serving clients digital certificates so they can use TLS and decrypt the TLS connections. Since Ingress controllers are Layer 7 proxies, they must perform TLS termination to read the contents of incoming requests and route each request to the right place.
Egress Requests
Egress requests are another type of data communication you should be aware of. These requests that the data plane’s microservices generate are to be handled outside the cluster.
Let’s look at an example of where an egress request traverses. Suppose a microservice inside the cluster generated a request destined for a microservice outside the cluster.
- In step 1, the microservice would send the request to its service proxy.
- In step 2, the service proxy would see that the request needed to go outside the cluster so that it would forward it out of the cluster to the external load balancer. The traffic does not go through the Ingress controller--the Ingress controller strictly handles Ingress requests, not egress requests.
- In step 3, the external load balancer would route the egress request on its path to the destination cluster.

Chapter 4: Service Mesh Benefits and Costs
In this chapter, we will talk about service mesh benefits and costs. A service mesh can provide numerous benefits for a cloud-native app. Common challenges that service mesh technologies can help address include service discovery, resilience, observability, and security. You’ll be learning about several service mesh features that can benefit your app.
We will also talk during this chapter about some of the downsides and the costs of using service meshes. Service meshes increase the app's complexity and add overhead by consuming resources and enlarging latency. Service mesh technologies are also rapidly evolving, so they take more effort to keep up with. We’ll guide when service mesh technologies are a good fit for a particular situation and when they’re not.
Service Mesh Features and Benefits
In previous chapters, we talked about how cloud-native apps face four common challenges with service-to-service communication: service discovery, resilience, observability, and security. A service mesh helps address all of these challenges, and it does so transparently, generally without needing changes to the app’s code.
In the last chapter, we discussed how service mesh control planes, data planes, and Ingress controllers work together. We looked at national, high-level architectures illustrating how data and control communications flow between the architecture components.
Now, we will talk about several features that service meshes commonly provide and explain how those features can benefit your organization’s development and operations. We’ll group these features by challenge category: service discovery, resilience, observability, and security.
This chapter generally covers service meshes based on the features they most often support. The chapter doesn’t attempt to list all the features that service meshes currently provide, nor does it always specify which service mesh technologies support each of the highlighted features. It will sometimes mention specific service mesh technologies when multiple technologies use different terms to refer to the same feature.
Service mesh technologies are constantly evolving, changing how they provide and perform their existing features and adding new features. Please visit its website for the latest information on current and planned features for any particular service mesh technology.
Service Discovery
In a service mesh, service discovery refers to the processes that find microservices and track where they are on the network. Service discovery can be performed in many ways, including using any existing Domain Name System (DNS) infrastructure, an existing strongly consistent key-value datastore, or a specialized service discovery solution. These methods are largely outside the scope of most service meshes.
What’s important to know about service discovery because the service mesh needs up-to-date information on what microservices are currently deployed and how to communicate with them. Without that information, the service mesh can’t function properly.
In addition, it’s necessary to ensure that as each microservice instance is deployed, it’s automatically assigned a service proxy that is deployed within its pod. The highly dynamic nature of microservices and the sheer number of instances mean that manually assigning service proxies every time another microservice instance is to be deployed is not feasible.
One term for these automatic service proxy assignments is automatic sidecar injection, with “sidecar” referring to the service proxy and “injection” referring to placing the service proxy inside the microservice instance’s pod. Another term is automatic proxy injection.
The communications between the microservice and the service proxy in a pod utilize the localhost loopback adapter. Every container in a pod has access to that pod’s localhost loopback adapter, which has IP address 127.0.0.1. The figure below depicts a simplified example of this. Each service proxy and microservice pair uses the localhost loopback adapter within their pod to communicate. Both the service proxy and the microservice use address 127.0.0.1 as the source and the destination when communicating inside the pod.
The localhost loopback adapter only has meaning within a single pod, and the 127.0.0.1 address is not routable, so communications outside the pod use a different, routable IP address for each service proxy. It’s important to understand that each pod has its localhost loopback adapter; any other service proxies cannot reach the 127.0.0.1 address used by one service proxy because they are all in different pods.

Resilience: Timeouts and Automatic Retries
The Resilience chapter discussed several resilience concepts, including timeouts and automatic retries. Let’s look at how service meshes support those concepts.
Timeouts and automatic retries sound very simple but can cause problems if misconfigured. For example, automatic retries can happen for too long, frustrating and impeding users. And if an issue is causing many automatic retries to occur simultaneously, the retries themselves can overwhelm systems and make things even slower.
Setting a low maximum number of automatic retries can help reduce the extent of this problem, but what should the maximum number be? Sometimes, you want more retries for one microservice and fewer for another. Also, a single maximum number for all situations doesn’t work well--sometimes you have many retries happening at once, so you might want the maximum lowered, and sometimes you have just a few retries happening and might want a higher maximum.
Service meshes can help address these problems in a few ways. The most common way is a service profile (in Linkerd) or a virtual service (in Istio). A service profile or virtual service gives you a way of defining the routes for a microservice. Once you define the routes, you can specify the timeout length and the maximum number of automatic retries for each route.
Note that service profiles and virtual services can also be used for other things. We’ll talk more about those shortly.
Some service meshes also offer an automatic retry capability called a retry budget. When a retry budget is used, the service mesh keeps track of how many first-time requests and how many retried requests are in progress at all times. The service mesh ensures that the ratio of first-time requests to retried requests stays at an acceptable level. Suppose that the ratio was set to 1:10. If there were 100 first-time requests in progress, the service mesh would have no more than 10 retried requests happening concurrently.
Resilience: Circuit Breakers
Some service mesh technologies support a circuit breaker capability. As we discussed in the Resilience chapter, a circuit breaker works by limiting the degree of service degradation or failures for a single instance of a microservice. When an instance exceeds that level, this trips the circuit breaker and causes the microservice instance to stop being used temporarily. Using circuit breakers can prevent a small problem from becoming a cascading failure.
The way circuit breakers are defined and implemented differs for every service mesh technology with circuit breaker functionality. Generally speaking. However, circuit breakers are defined through groups of configuration settings that specify which conditions should be monitored and at what point the circuit breaker should be tripped.
Resilience: Load Balancing
Every service mesh supports at least one type of load balancing for requests. Some, like Istio and Kuma, use round-robin load balancing by default but support other types, like weighted request assignments. Linkerd “uses an algorithm called EWMA, or exponentially weighted moving average, to automatically send requests to the fastest endpoints.” (https://linkerd.io/2/features/load-balancing/)
Load balancing can be used for several special purposes to help development and operations.
The idea is to deploy more than one version or configuration of one or more microservices and then configure the service mesh to send a certain percentage of requests to each version or configuration. This allows new code, configuration settings, or other aspects of microservices to be tested and compared to the existing code, settings, etc.
The general terms for using load balancing in this way are traffic shifting and traffic splitting.
These terms have not been defined and used consistently, so considerable confusion exists. Most often, traffic shifting refers to gradually transferring requests from one version or configuration of a microservice to another that replaces the original. In contrast, traffic splitting means dividing requests among two or more versions or configurations to compare them in some way. However, these two features are often combined, like comparing multiple versions and then transitioning users to a particular version.
Instead of saying only “traffic shifting” or “traffic splitting,” it’s generally clearer to state the reason for changing where traffic goes. Here are some examples of common reasons.
A/B testing involves an experiment involving two versions or configurations of a microservice, A and B. This could be done for business reasons, such as how people respond to a new app feature, or for operational reasons, such as how new microservice tunings affect performance under load. The figure below shows how requests might be split 50/50 between two microservice versions, each one trying out a new app feature.

Blue-green deployment refers to having two production environments, one designated by blue and the other by green. Say that your users currently interact with the app you’re running in the blue environment. You would deploy the next version of your app in the green environment and do your final testing there.
The figure below depicts how the two app versions might run concurrently in the two environments. On the left side, all requests are going to the blue environment. When you’re ready to transition your users to the next version, you shift all new requests from the blue environment to the green one, as the right side shows. If there’s a problem with the new version, you can quickly shift new requests back to the blue environment, which is still running the previous version.

Canary deployment, canary rollout, and canary release all refer to testing a new microservice--the canary--by sending a percentage of requests to the new microservice and gradually increasing that percentage over time. The figure below shows how the percentage of requests going to the current and the new microservice could change over time. The canary deployment ends when all requests are going to the new version.

Resilience: Fault Injection
Another resilience feature that most service mesh technologies support is called fault injection. Fault injection means you can test your app by having faults (errors) purposely generated to see how they affect the app. This can be a great way to simulate various conditions and ensure that the app behaves how you expect it to.
The mechanisms you use to configure fault injection vary widely among service mesh technologies. What they have in common is flexibility. As all traffic passes through both the initiating and receiving microservices, you can make it appear that a microservice is returning any HTTP error code you want or that a microservice has timed out on a request. You can change the fault injection as often as you need to, and you can start and stop it anytime.
Fault injection through service mesh technology is far more convenient than altering the app microservices’ code to simulate faults. The service mesh can inject many of the same error conditions and other adverse circumstances on its own without having to alter the app code at all.
Observability: Telemetry and Metrics
In addition to service discovery and resilience, service mesh technologies can help with app observability. Observability is being able to monitor an app’s state and determine at a high level what happens when something goes wrong.
Two terms that are frequently used when discussing observability are metrics and telemetry. Telemetry means data collection to measure something, and metrics is another name for those measures.
Engineers at Google have proposed what are called the Four Golden Signals. They think These metrics are particularly important to collect when monitoring distributed systems, including cloud-native apps. Here’s a brief description of the four “golden” metrics within the context of microservices and service mesh technologies:
- Latency: how long it takes to receive a reply for a request
- Traffic: how much demand the system is under, such as requests per second
- Errors: What percentage of requests result in an error
- Saturation: how close the available resources, like processing or memory, are to be fully utilized
Service mesh technologies typically support collecting most or all of the four golden metrics, and they usually support collecting additional metrics. Service mesh technologies also offer multiple ways to access their metrics, such as viewing them through graphical dashboards and exporting them through APIs for use in other tools.
Observability: Distributed Tracing
Another way that service meshes provide observability is through distributed tracing. The idea behind distributed tracing is to add a special trace header to each request, with a unique ID inside each header. Typically, this unique ID is a universally unique identifier (UUID) added at the point of Ingress. This way, each ID typically relates to a user-initiated request, which can be useful when troubleshooting. Each request can be uniquely identified, and its flow through the mesh monitored--where and when it traverses.
Every service mesh implements distributed tracing differently, but they have a few things in common. They all require the app code to be modified so each request will have the unique trace header added and propagated through the entire call chain of services. They also require the use of a separate tracing backend.
Distributed tracing is intended to be used when metrics and other information already collected by the service mesh don’t provide enough information to troubleshoot a problem or understand an unexpected behavior. When used, distributed tracing can provide valuable insights as to what’s happening within a service mesh.
All the service meshes use the same specification for their trace headers: B3. If you’re interested, you can learn more about the B3 trace header specification at https://github.com/openzipkin/b3-propagation (https://github.com/openzipkin/b3-propagation).
Security: Mutual TLS
Service meshes can protect the communications between pods by using Transport Layer Security (TLS), a cryptographic protocol. TLS uses cryptography to ensure that others can’t monitor or alter the information being communicated. For example, if a malicious actor had access to the networks the service mesh uses, that actor wouldn’t be able to see the information being transferred in the microservice-to-microservice communications.
In service meshes, TLS is used between service proxies. Service meshes actually use a form of
TLS called mutual TLS. Each service proxy has a secret cryptographic key that confirms its identity and allows it to decrypt the communications it receives. Each service proxy also has a certificate for every other service proxy that allows it to encrypt the communications it sends so that only the intended recipient can decrypt them.
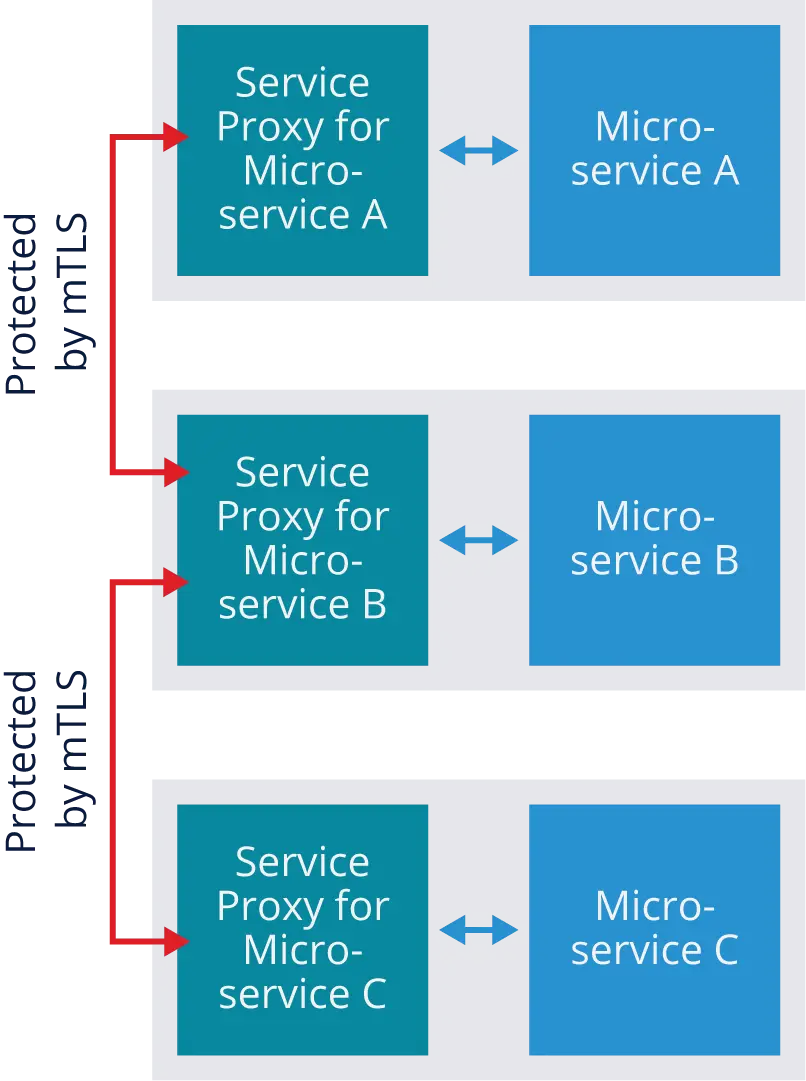
Basically, as part of initiating any communications from pod to pod, each service proxy first verifies the identity of the other service proxy through authentication, then encrypts their communications so that no other service proxies can access it. The figure below shows a simplified example of this. One mTLS session protects the communications between the service proxies for A and B, and another mTLS session provides similar protection for communications between B and C. Because each microservice instance has a unique key, each session is encrypted in a way that only that particular microservice instance can decrypt.
It’s also important to note that mTLS only protects the communications between service proxies. It does not protect the communication within pods between a service proxy and its microservice. Service mesh architectures assume that if an attacker already has access inside the pod, there’s no point in encrypting the traffic because the attacker could access the unencrypted information regardless.
Another benefit of mutual TLS is that because it confirms the identities of each service proxy, it gives the service mesh the ability to segment the network based on those identities. Instead of the old security models that enforced policies based on IP address, new security models can enforce policies based on service proxy identity. You could create rulesets, for example, that prevent highly-trusted microservices that handle sensitive information from receiving requests from low-trusted microservices. Enforcing trust boundaries through identities verified by mutual TLS helps prevent attackers from laterally moving through microservices to reach the assets of the greatest value.
Service Mesh Disadvantages and Costs
Service meshes can provide many benefits, but those benefits come at a cost. Service meshes have significant disadvantages that must be considered before you decide to implement a service mesh. Common disadvantages include the following:
- Increased complexity. With a service mesh, there are more components in the architecture. This means more things can go wrong. It also means it’s harder for people to understand all the components and how they work together, so tasks like configuring the components properly and troubleshooting problems will be more challenging.
- More overhead. The additional components of a service mesh mean more computing and other resources will be needed, and there may be more communication latency. The extent to which extra resources are needed and latency occurs will differ for every service mesh use case.
- The rapid evolution of service mesh technologies. Service mesh technologies are still quite new, and they are frequently changing. Although this is good in some ways, like adding new features, it also means that these technologies aren’t necessarily stable. You may need to make a conscious effort to keep up with the latest developments in your service mesh technology so that you’re prepared to change configurations or make other adjustments as new versions become available.
When Do You Need a Service Mesh?
Not every cloud-native app deployed with microservices needs a service mesh. Many apps do not need a service mesh, and adding a service mesh to them might do more harm than good. You should consider two important factors when deciding whether a service mesh is right for a particular situation.
1. The number of microservices. If your app has a small number of microservices, the benefits of using a service mesh will be limited. Say that your app has two microservices. There’s not much a service mesh can do to improve resilience and observability from their existing states.
As the number of microservices in an app increases, the growing complexity of the app makes a service mesh more beneficial for supporting resilience, observability, and security among all the microservices and their interrelationships.
2. The microservice topology. This refers to the flows of the microservices being called and calling each other. In a shallow topology, there’s not much interaction between microservices; most requests come from outside the cluster. Service meshes usually don’t provide much value in shallow topologies because they primarily handle service-to-service requests.
In deeper microservice topologies, with many microservices sending requests to other microservices, which in turn send requests to other microservices, and so on, service meshes can be invaluable in having visibility into these requests, as well as securing the communications and adding resilience features to prevent cascading failures and other issues.
Consider these factors for the two figures below. The first figure shows an app with three microservices where all of them are being called from the outside only--none of them are sending requests to each other. This is not a strong candidate for a service mesh because there’s little a service mesh could do for this particular app. It can’t help much with resilience, security, or observability; using a service mesh would add complexity.
The second figure shows a topology with many more microservices and several paths chaining multiple microservices in sequence, the longest possible path traversing six microservices. With the observability provided by a service mesh, failures within this topology may be easier to track down. Without a service mesh’s resilience features, a failure within this topology could escalate into a cascading failure that takes down the entire distributed system. Also, the service mesh’s use of mTLS provides security for all the microservice-to-microservice communications. For this topology, a service mesh could be beneficial in several ways.
If you’re unsure if a service mesh is needed for a particular situation, consider whether an Ingress controller alone may be sufficient. There is some overlap in the features provided by Ingress controllers and service meshes, particularly for resilience and observability.
The biggest difference between Ingress controllers and service meshes is that in a service mesh, you control all communication between the microservices; with an Ingress controller, you don’t. An implication of that is when you adopt a service mesh; it will affect the development of your microservices and app. With an Ingress controller, there’s no such impact.
Chapter 5: Service Mesh Interface (SMI)
In this chapter, we will talk about Service Mesh Interface or SMI. SMI is a specification currently under development. It defines a standard set of application programming interfaces (APIs) for service meshes on Kubernetes clusters. The goal for SMI is to support interoperability for common service mesh features.
We’ll be looking during this chapter at several of the SMI APIs that are being developed.
Introduction to Service Mesh Interface (SMI)
Service Mesh Interface (SMI) is a Kubernetes-native specification under active development. It defines a standard set of Kubernetes Custom Resource Definitions (CRDs) and APIs for service meshes. The SMI development process is open, relying on community participation, and the specification itself is publicly available under an Apache 2.0 license.
As stated on the SMI website, “the goal of the SMI API is to provide a common, portable set of service mesh APIs which a Kubernetes user can use in a provider agnostic manner. In this way, people can define applications that use service mesh technology without tightly binding to any specific implementation.” SMI doesn’t include a service mesh implementation; it’s solely a specification that service mesh implementations can use.
Without a standard like SMI, every service mesh technology would have completely different APIs. That would make things more complicated and time-consuming for developers, platform, and DevOps teams. Instead of using SMI APIs, developers must write their code to provide equivalent functionality. Integration with other technologies and tools would take more effort, as would changing the app's service mesh technology.
Here, we’ll take a closer look at four SMI APIs that help to manage, secure, and observe service-to-service traffic within a cluster:
- Traffic Specs
- Traffic Split
- Traffic Access Control
- Traffic Metrics
All of these APIs involve service mesh concepts we examine in this piece about resilience, specifically load balancing (https://www.getambassador.io/learn/service-mesh/resilience-for-distributed-systems/); we’ll be building on that knowledge and focusing specifically on examples of what these APIs support and how they can be used.
Note that adoption of the SMI APIs by service mesh technologies is ongoing. Also, SMI itself is rapidly evolving, with updates being made constantly. For the foreseeable future, common service mesh technologies will likely offer different degrees of support for each of the SMI APIs.
The SMI website is at https://smi-spec.io (https://smi-spec.io/), and it contains basic information on what SMI is.
The SMI specification is in a GitHub repository at https://github.com/servicemeshinterface/smi-spec (https://github.com/servicemeshinterface/smi-spec).
Traffic Specs API
The Traffic Specs API allows you to define routes that an app can use. This is hard to explain without an example, so let’s look at one to show what that means.
This example illustrates how a resource named m-routes can be defined using HTTPRouteGroup from the Traffic Specs API. It’s based on an example in the SMI specification (https://github.com/servicemeshinterface/smi-spec). It will match any HTTP GET request the app sees with the string “/metrics” in its path.
By itself, HTTPRouteGroup doesn’t do anything. It matches, but it doesn’t act on the match in any way. It’s meant to be used by other SMI APIs that do act. So, for example, the Traffic Split API could reference this group in one of its own resources, like declaring that traffic matching the m-routes definition should be split evenly between two versions of a particular microservice.
kind: HTTPRouteGroup
metadata:
name: m-routes
spec:
matches:
- name: metrics
pathRegex: "/metrics"
methods:
- GET
Traffic Split API
The Traffic Split API allows you to implement traffic splitting and traffic shifting methods like A/B testing, blue-green deployment, and canary deployment.
Here’s an example of defining a TrafficSplit for a canary deployment. Under backends, there are two services named e8-widget-svc-current and e8-widget-svc-patch. New requests will be routed to these services (actually microservices). There’s a weight assigned to each service. These look like percentages--75 and 25, which add up to 100--but they’re not actually percentages. You could specify 750 and 250, or 3 and 1, or any other pair of numbers that have that 3 to 1 ratio to achieve the same results.
kind: TrafficSplit
metadata:
name: e8-feature-test
namespace: e8app
spec:
service: e8-widget-svc
backends:
- service: e8-widget-svc-current
weight: 75
- service: e8-widget-svc-patch
weight: 25
Over time, to continue the canary deployment, you would update the weights: for example, you might next set these to 50 and 50. If that goes well, the next step might be 25 and 75, with 0 and 100 being the last.
To use TrafficSplit for A/B testing, you assign the same weight to each service.
For a blue-green deployment with TrafficSplit, you would initially weight the blue environment service set to 100 and the weight for the green environment service set to 0. When you’re ready to switch from the blue environment to the green environment, you will swap the 100 and 0 weights to route all new requests to the green environment service.
If you want to do a traffic split with three or more services, you would simply list each of the services under backends and assign a weight to each. Here’s an example where the baseline version of a service gets half of the requests, and two other versions testing new features each get one-fourth of the requests:
kind: TrafficSplit
metadata:
name: e8-feature-test
namespace: e8app
spec:
service: e8-render-svc
backends:
- service: e8-render-svc-baseline
weight: 50
- service: e8-render-svc-feature1
weight: 25
- service: e8-render-svc-feature2
weight: 25
Traffic Access Control API
The Traffic Access Control API allows you to set access control policies for pod-to-pod (service proxy to service proxy) communications based on service proxy identity. When you use this API, by default, all traffic is denied. You have to explicitly grant permission for any type of traffic you want to allow.
Here’s an example of defining a TrafficTarget based on an example from the SMI specification (https://github.com/servicemeshinterface/smi-spec). Under spec, three things are defined:
- sources, which specify the pods that may be the sources of the traffic.
- destination, which specifies the pods that may be the destinations of the traffic.
- rules, which define the characteristics the traffic must have to be allowed to reach its destination.
In this example, traffic is being allowed from pods with a Prometheus service account to pods with a service-a-service account when the traffic is being sent to port 8080. The traffic is only allowed when it matches the rules, which, in this case, the traffic matches the m-routesHTTPRouteGroup example we looked at in the Traffic Specs API section. m-routes will match any HTTP GET request with the string “/metrics'' in its path.
To recap: In this TrafficTarget example,
- HTTP GET requests with the string “/metrics” in their path
- that are sent from pods with a Prometheus service account
- and that is going to port 8080 on pods with a service-a-service account
- will be allowed.
kind: TrafficTarget
metadata:
name: path-specific
namespace: default
spec:
destination:
kind: ServiceAccount
name: service-a
namespace: default
port: 8080
rules:
- kind: HTTPRouteGroup
name: m-routes
matches:
- metrics
sources:
- kind: ServiceAccount
name: prometheus
namespace: default
Some of the elements in this example are optional. For example, if you don’t specify a port for the destination, the TrafficTarget will apply no matter what the destination port is. Additional elements can also be specified, like defining a port for the sources so this TrafficTarget would only apply to traffic with that source port. You can also have multiple entries under sources, destination, and rules.
Traffic Metrics API
The Traffic Metrics API allows you to collect metrics on HTTP traffic and make those metrics available to other tools. Each metric involves a Kubernetes resource, either a lower-level one like a pod or a service or a higher-level one like a namespace. Each metric is also limited to a particular edge, another term for the traffic’s source or destination. Note that an edge can be set as blank, which would match all traffic.
Here’s an example of defining TrafficMetrics, based on an example from the SMI specification (https://github.com/servicemeshinterface/smi-spec); it defines several things:
- resource, which specifies the source of the traffic to collect the metrics for.
- edge, which specifies the destination of the traffic to collect the metrics for.
- timestamp, which specifies when the definition was created.
- window, which specifies the time period to be used for calculating the metrics. In this example, 30 seconds is specified, so metrics will be calculated on the past 30 seconds of activity.
- metrics, which list the metrics to be collected. In this example, the metrics will include data on response latency and on successful and failed requests.
kind: TrafficMetrics
# See ObjectReference v1 core for full spec
resource:
name: foo-775b9cbd88-ntxsl
namespace: foobar
kind: Pod
edge:
direction: to
side: client
resource:
name: baz-577db7d977-lsk2q
namespace: foobar
kind: Pod
timestamp: 2019-04-08T22:25:55Z
window: 30s
metrics:
- name: p99_response_latency
unit: seconds
value: 10m
- name: p90_response_latency
unit: seconds
value: 10m
- name: p50_response_latency
unit: seconds
value: 10m
- name: success_count
value: 100
- name: failure_count
value: 100
The Traffic Metrics API is in its early stages, so its support of individual metrics could be improved.
Chapter 6: Using Service Mesh to Debug and Mitigate App Failures
Here, we discuss using a service mesh to debug and mitigate app failures. We’ll look at several of the capabilities that service meshes may provide. Each service mesh technology supports a unique set of such capabilities.
We use examples from Linkerd to illustrate service meshes' capabilities, but the fundamental concepts discussed here will apply to any service mesh.
Service Mesh Status Checks
In many situations, it’s helpful first to check the status of the service mesh components. If the mesh itself is having a failure--such as its control plane not working--then the app failures you are seeing may be caused by a larger problem and not an issue with the app itself.
Below is an example of possible output from running the Linkerd check command. Take some time to review each group of checks in this output. There’s a link to the
Linkerd documentation for each group of checks to learn more about them and see examples of failures.
1. Can the service mesh communicate with Kubernetes? (kubernetes-api checks (https://linkerd.io/2/tasks/troubleshooting/#k8s-api))
kubernetes-api
--------------
√ can initialize the client
√ can query the Kubernetes API
2. Is the Kubernetes version compatible with the service mesh version? (kubernetes-version checks (https://linkerd.io/2/tasks/troubleshooting/#k8s-version))
kubernetes-version
------------------
√ is running the minimum Kubernetes API version
√ is running the minimum kubectl version
3. Is the service mesh installed and running? (linkerd-existence checks (https://linkerd.io/2/tasks/troubleshooting/#l5d-existence))
linkerd-existence
-----------------
√ 'linkerd-config' config map exists
√ heartbeat ServiceAccount exist
√ control plane replica sets are ready
√ no unschedulable pods
√ controller pod is running
√ can initialize the client
√ can query the control plane API
4. Is the service mesh’s control plane properly configured? (linkerd-config checks (https://linkerd.io/2/tasks/troubleshooting/#l5d-config))
linkerd-config
--------------
√ control plane Namespace exists
√ control plane ClusterRoles exist
√ control plane ClusterRoleBindings exist
√ control plane ServiceAccounts exist
√ control plane CustomResourceDefinitions exist
√ control plane MutatingWebhookConfigurations exist
√ control plane ValidatingWebhookConfigurations exist
√ control plane PodSecurityPolicies exist
5. Are the service mesh’s credentials valid and up to date? (linkerd-identity checks (https://linkerd.io/2/tasks/troubleshooting/#l5d-identity))
linkerd-identity
----------------
√ certificate config is valid
√ trust anchors are using supported crypto algorithm
√ trust anchors are within their validity period
√ trust anchors are valid for at least 60 days
√ issuer cert is using supported crypto algorithm
√ issuer cert is within its validity period
√ issuer cert is valid for at least 60 days
√ issuer cert is issued by the trust anchor
6. Is the API for the control plane running and ready? (linkerd-api checks (https://linkerd.io/2/tasks/troubleshooting/#l5d-api))
linkerd-api
-----------
√ control plane pods are ready
√ control plane self-check
√ [kubernetes] control plane can talk to Kubernetes
√ [prometheus] control plane can talk to Prometheus
√ tap api service is running
7. Is the service mesh installation up to date? (linkerd-version checks (https://linkerd.io/2/tasks/troubleshooting/#l5d-version))
linkerd-version
---------------
√ can determine the latest version
√ cli is up-to-date
8. Is the service mesh control plane up to date? (control-plane-version checks (https://linkerd.io/2/tasks/troubleshooting/#l5d-version-control))
control-plane-version
---------------------
√ control plane is up-to-date
√ control plane and cli versions match
If any of the status checks failed, you would see output similar to the example below. It would indicate which check failed, and often also provide you with additional information on the nature of the failure to help you with troubleshooting it.
linkerd-api
-----------
√ control plane pods are ready
√ control plane self-check
√ [kubernetes] control plane can talk to Kubernetes
× [prometheus] control plane can talk to Prometheus
Error calling Prometheus from the control plane:
server_error: server error: 503
see https://linkerd.io/checks/#l5d-api-control-api for hints
If all of the status checks passed and no issues were detected, the last line of the output will be like this one:
Status check results are √
Service Proxy Status Checks
Sometimes, you may want to do a status check for other aspects of the service mesh in addition to or instead of the ones you’ve just reviewed. For instance, you may just want to check the status of the service proxies your app should use. In Linkerd, you can do that by adding the --proxy flag to the linkerd check command.
Note that Linkerd refers to “service proxies” as “data plane proxies.”
Below is an excerpt of possible output from running linkerd check --proxy. This command runs all the same checks as the linkerd check command, plus a few additional ones specific to data planes. The duplication of the linkerd check output has been omitted here for brevity. The sample output shows the additional checks performed because of the --proxy flag.
9. Are the credentials for each data plane proxies valid and up to date? (linkerd-identity-data-plane (https://linkerd.io/2/tasks/troubleshooting/#l5d-identity-data-plane))
linkerd-identity-data-plane
---------------------------
√ data plane proxies certificate match CA
10. Are the data plane proxies running and working fine? (linkerd-identity-data-plane)
linkerd-data-plane
------------------
√ data plane namespace exists
√ data plane proxies are ready
√ data plane proxy metrics are present in Prometheus
√ data plane is up-to-date
√ data plane and cli versions match
There are additional ways to perform status checks for Linkerd service meshes. For more information on the linkerd check command and the flags it can use to perform different checks, see https://linkerd.io/2/reference/cli/check/ (https://linkerd.io/2/reference/cli/check/) and https://linkerd.io/2/tasks/troubleshooting/ (https://linkerd.io/2/tasks/troubleshooting/).
Service Route Metrics
If your service mesh status checks don’t report any problems, a common next step in troubleshooting is to look at the metrics for the app’s service routes in the mesh. In other words, you want to see measurements of how each of the routes within the mesh the app uses performs. These measurements are often useful for purposes other than troubleshooting, such as determining how the performance of an app could be improved.
Let’s suppose that you’re troubleshooting an app that is experiencing intermittent slowdowns and failures. You could look at the per-route metrics for the app to see if there’s a particular route that is the cause or is involved somehow.
The linkerd routes command returns a snapshot of the performance metrics for each route within a particular scope. That scope is defined by what’s called a service profile. (You’ll learn more about service profiles in the next section.) Below is an example of the command’s output header and one line of sample metrics. They have been reformatted from the original to improve their readability.
ROUTE SERVICE SUCCESS RPS LATENCY_P50 LATENCY_P95 LATENCY_P99
GET / webapp 100.00% 0.6rps 15ms 20ms 20ms
By default, the metrics are for inbound requests only. This example shows the performance of requests made over the “GET /” route to the webapp service. In this case, 100% of the recent requests succeeded, with an average of 0.6 requests processed per second.
The three latency metrics indicate how long it took to handle the requests based on percentiles. P50 refers to the 50th percentile--the median time, in this case, 15 milliseconds. P95 refers to the 95th percentile, which indicates that the app is handling 95 percent of the requests as fast as or faster than 20 milliseconds. P99 provides the same type of measurement for the 99th percentile.
Viewing the metrics for each route can indicate where slowdowns or failures are occurring within the mesh and where things are functioning normally. It can narrow down what the problem might be or, in some cases, point you right to the culprit.
Service Route Configuration for Issue Mitigation
You can change the configuration of particular service routes to mitigate problems. For example, you could change the timeouts and automatic retries for a particular route so that attempts to a problematic pod switch to another pod more quickly. That could reduce user delays while you continue troubleshooting the problem or a developer changes code to address the underlying issue.
In Linkerd, the mechanism for configuring a route is called a service profile. As mentioned earlier, service profiles can also be used to specify which routes to provide metrics on for the linkerd routes command.
For more information on creating and using service profiles, see https://linkerd.io/2/features/service-profiles/ (https://linkerd.io/2/features/service-profiles/).
Request Logging
If you need more detail about requests and responses than you can get from the service route metrics, do logging of the individual requests and responses.
Caution: logging requests can generate a rapidly growing amount of log data. In many cases, you will only need to see a few logged requests, not massive volumes.
Here is an example of a few logged requests. This log was generated by running the linkerd tap command. Blank lines have been added between the log entries to improve readability. These three entries all involve the same request.
The first one shows what the request was, and the second shows the returned status code (in this case, a 503, Service Unavailable). The second and third entries contain metrics for handling this request. This additional information, beyond what could be seen in route-level metrics, may help you to narrow your search for the problem.
req id=9:49 proxy=out src=10.244.0.53:37820 dst=10.244.0.50:7001 tls=true :method=HEAD :authority=authors:7001 :path=/authors/3252.json
rsp id=9:49 proxy=out src=10.244.0.53:37820 dst=10.244.0.50:7001 tls=true :status=503 latency=2197µs
end id=9:49 proxy=out src=10.244.0.53:37820 dst=10.244.0.50:7001 tls=true duration=16µs response-length=0B
For more information on the linkerd tap command, see https://linkerd.io/2/reference/cli/tap/ (https://linkerd.io/2/reference/cli/tap/).
Service Proxy Logging
Sometimes you want to better understand what is happening within a particular service proxy. You may be able to do that by increasing the extent of the logging that the service proxy is performing, such as recording more events or recording more details about each event.
Be very careful before altering service proxy logging because it can negatively impact the proxy’s performance, and the volume of the logs themselves can also be overwhelming.
Linkerd allows its service proxy log level to be changed in various ways. For more information, see https://linkerd.io/2/tasks/modifying-proxy-log-level/ (https://linkerd.io/2/tasks/modifying-proxy-log-level/) and https://linkerd.io/2/reference/proxy-log-level/ (https://linkerd.io/2/reference/proxy-log-level/) .
Here is an example of what Linkerd’s service proxy logs may look like.
[ 326.996211471s] WARN inbound:accept{peer.addr=10.244.0.111:55288}:source{target.addr=10.244.0.131:7002}:http1{name=books.booksapp.svc.cluster.local:7002 port=7002 keep_alive=true wants_h1_upgrade=false was_absolute_form=false}:profile{addr=books.booksapp.svc.cluster.local:7002}:daemon:poll_profile: linkerd2_service_profiles::client: Could not fetch profile error=grpc-status: Unavailable, grpc-message: "proxy max-concurrency exhausted"
Injecting a Debug Container
If you need to take an even closer look at what’s happening inside a pod, you may be able to have your service mesh inject a debug container into that pod. A debug container is designed to monitor the pod's activity and collect information on that activity, such as capturing network packets.
In Linkerd, you can inject a debug container by adding the --enable-debug-sidecar flag to the linkerd inject command. You can then open a shell to the debug container and issue commands within the container to gather more information and continue troubleshooting the problem.
For more information on using Linkerd’s debug container (called the “debug sidecar,”) see https://linkerd.io/2/tasks/using-the-debug-container/ (https://linkerd.io/2/tasks/using-the-debug-container/) .
Using the Telepresence Tool
Telepresence (https://www.telepresence.io/)is a debugging tool hosted by the Cloud Native Computing Foundation (CNCF). It can be used instead of or in addition to injecting a debug container so you can examine what’s happening inside a pod.
Using Telepresence, you can run a single process (a service or debug tool) locally, and a two-way network proxy enables that local service to operate effectively as part of the remote Kubernetes cluster. This architecture means that Telepresence is usually not run in production clusters; it’s intended for use in testing or staging.
Because you are running a service locally, you can use whatever debugging or testing tools you’d like to monitor and probe the executing service. You can also edit your service using whatever tool you choose.